USD/CNH Tests the Ichimoku Cloud with Bearish Outlook

The USD/CNH currency pair broke below the ascending trendline and the 7.24 immediate support. As of writing, the currency pair trades at about 7.246, testing the Ichimoku cloud. The technical indicators signal a bearish trend resumption. The RSI (14) is below the median line, reading 39. The Awesome oscillator is below the signal line, with red bars and decreasing values.
From a technical perspective, the descending trendline is the key resistance to the downtrend. If the USD/CNH price hovers below the trendline, the next bearish target could be 7.236.
Conversely, the bearish outlook should be invalidated if the price crosses the descending trendline. If this scenario unfolds, the 7.275 ceiling will be retested.
Gold Prices Surge Amid Speculation of Fed Rate Cuts

Solid ECN—Gold prices climbed to $2,370 per ounce on Thursday, continuing the upward trend from the previous day. This increase came after U.S. economic reports suggested that the Federal Reserve could lower interest rates later this year.
Data from ADP revealed that U.S. private job growth in May was weaker than expected, and figures for the previous month were also adjusted downwards. This points to a slowing, yet still robust, job market.
Consequently, market players expect the Fed to implement two rate cuts this year, with a 70% probability of one occurring in September, according to the CME FedWatch Tool. Investors now look forward to Friday’s non-farm payroll figures to further evaluate the U.S. economy and gain insights into the Fed’s rate cut plans.
In related news, the Bank of Canada reduced its primary interest rate on Wednesday, marking its first cut in four years, and the European Central Bank is likely to decrease rates later today.
Navigating the Recent Silver Price Drop

Solid ECN—Silver prices dropped below $30 per ounce after hitting an 11-year peak of $32 on May 28th. This decline comes as investors weigh major central banks’ future interest rate policies and the demand for silver from key industrial users. In response to China’s extensive use of silver in solar cell manufacturing, the US has implemented a 50% tariff on these imports.
This move aims to curb demand for panels made primarily in China and other Southeast Asian countries. Despite these tariffs, robust demand within China has helped prevent a more significant price drop. This resilience is highlighted by the recent activation of Xinjiang’s world’s largest solar farm.
Additionally, the expectation that central banks, including the ECB and BoC, will soon reduce interest rates has helped limit the fall in silver prices, as lower rates decrease the cost of holding non-income-generating assets like silver.
Gold Declines Amid Overbought Stochastic Oscillator

Solid ECN—The XAU/USD declined after the bulls broke from the 50% Fibonacci level in today’s trading session. This development in the gold price has driven the stochastic oscillator into the overbought area. Therefore, the current phase should be considered as consolidation.
The primary trend is bullish, and the technical indicators point to the bullish wave resuming. However, for the uptrend to continue, the price must stabilize above the SMA 100 (blue line). If this scenario comes into play, the 38.2% Fibonacci level will be the next target.
Conversely, the oversold stochastic might escalate today’s decline from $2,370. The immediate support is at $2,354. If this level is breached by the bears, the next bearish target will be the 61.8% Fibonacci level, which is backed by SMA 50 (red).
NZD/USD Consolidation Phase Analysis

Solid ECN—The NZD/USD currency pair trades in a range area between $0.617 immediate support and $0.621 immediate resistance. The technical indicators suggest low momentum in the market, but with a weak bearish bias. Therefore, the currency pair might break below the immediate resistance.
From a technical standpoint, for the uptrend to resume, the bulls must cross and stabilize the price above the $0.621 ceiling.
On the flip side, if the price dips below the immediate support at $0.617, the consolidation phase will likely extend to the key support level at $0.613. This level is backed by the Ichimoku cloud, which makes it a robust supply zone.
EUR/USD Breaks Key Resistance

Solid ECN—The EUR/USD currency pair broke below the 1.078 key resistance on Monday, and as of writing, the currency pair traded approximately at 1.0765. The technical indicators suggest the downtrend should resume to lower resistance levels.
The immediate resistance is at 1.0787. If this level holds, the bearish momentum will likely test the 1.0723 mark. Furthermore, if this demand zone breaches, the decline could extend to 1.0676.
On the flip side, if the bulls cross above the immediate resistance, the pullback that began today could target 1.0852.
GBP/USD DeMark Indicator Signals Oversold
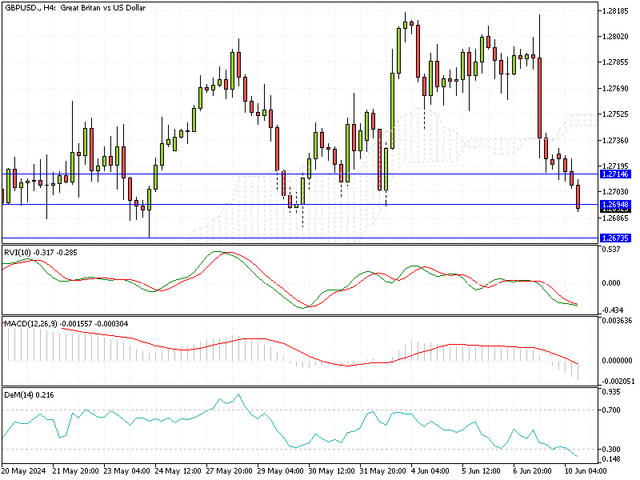
Solid ECN—The DeMark indicator in the GBP/USD 4-hour chart suggests the pair is oversold, hovering below the 0.3 line. As of this writing, the pair tests the 1.269 resistance. A pullback could be imminent, and it is not wise to go short in an oversold market. Therefore, traders should wait patiently for the price to consolidate.
If the price remains below the immediate support level at 1.271, the next bearish target should be set at 1.267.
On the flip side, the bearish outlook should be invalidated if the GBP/USD price rises above the Ichimoku cloud.
AUD/USD Consolidation Phase Exceeded 23.6% Fibonacci

The AUD/USD pair consolidates after dipping to a low of 0.657. The current pullback was anticipated as the pair formed a doji candlestick today. Currently, the AUD/USD is attempting to close and stabilize above the 23.6% Fibonacci retracement level. Technical indicators on the 4-hour chart indicate a ranging market with weakening bearish momentum.
Immediate support is at $0.659. The 38.2% Fibonacci resistance level will likely be targeted if the exchange rate stays above this level. If the price exceeds $0.662, the 50% Fibonacci level, supported by the Ichimoku cloud, could be the next target.
Conversely, if AUD/USD declines below the immediate support at $0.659, it will likely test the 0.657 level again. Should selling pressure increase, the May 8th low of $0.655 should be considered the next support level.
NZD/USD Poised for Breakout: Key Levels to Watch

Solid ECN—The NZD/USD currency pair retreated from 0.6099 and tested the immediate resistance at 0.6132 today. Indicators such as the RVI and MACD suggest that the bullish trend is likely to continue. Notably, the stochastic oscillator is moving out of the oversold zone.
From a technical perspective, for the uptrend to continue, buyers need to push the price above the 0.613 resistance. If this happens, the pullback will likely target the 0.617 resistance.
Conversely, if sellers keep the price below the immediate resistance, the decline that started on June 6 is expected to test the key support level at 0.6088. If the selling pressure breaks this level, the next support will be at 0.604.
Overbought USD/JPY Signals Potential Consolidation

Solid ECN—The U.S. Dollar traded above the 78.6% Fibonacci level against the Japanese yen at about 157.2. The primary trend is bullish; however, the Demarker indicator signals an overbought market by hovering above the 0.7 level. This development in the indicator means the USD/JPY price might consolidate to the lower resistance levels.
Additionally, the 4-Hour chart shows the Bollinger bands are narrowing, signaling a range market. This aligns with the Demarker signal, pointing to the momentum easing on the uptrend.
From a technical standpoint, the USD/JPY is in a bull market, but the U.S. Dollar appears overpriced. It is likely for the bears to dip the price below the 157.0 immediate support. If this scenario unfolds, the consolidation phase may extend to the 61.8% Fibonacci at 156.4. This level provides a decent entry point to join the bull market.
Conversely, the key resistance level is at 157.7. Should the bulls cross above this key barrier, the uptrend will likely resume. If this scenario unfolds, April’s high at 160.2 could be set as the next significant barrier.
Overbought USD/CHF Signals Bearish Potential

Solid ECN—The USD/CHF currency pair is in a state of being overbought, according to the Demarker indicator, which hovers above the 0.7 line. As of writing, the pair has risen to test the 0.90 (Murrey 3/8) immediate resistance. If this level is breached, the next bullish target will be the 0.903 key resistance (Murrey 4/8).
Conversely, if the price dips below the key resistance level at 0.897 (Murrey 2/8), the overbought market will signal a bearish wave that will likely target 0.894 (Murrey 1/8), followed by 0.8911 key resistance.
USD/CHF Bulls Eye Key Resistance Levels

Solid ECN—The USD/CHF bulls are trying to stabilize the price above the simple moving average (SMA) of 25 and Murrey 2/8 at 0.897, a resistance level coinciding with the Ichimoku cloud. However, the technical indicators suggest the market is bearish and the downtrend will likely resume.
Hence, if the price dips below the SMA 25, the next key resistance will be at Murrey 0/8 at 0.8911. If the selling pressure exceeds this level, the -1/8 Murrey at 0.888 could be tested again.
On the flip side, the key resistance level that supports the bearish scenario is Murrey 3/8 at 0.9. Should this level be breached, the pullback from 0.888 can extend to Murrey 4/8 at 0.903.
EUR/USD Analysis: Critical Support and Potential Rebound

Solid ECN—EUR/USD is testing the crucial $1.067 support level, while the Demarker indicator shows the market is deeply oversold. The 4-hour chart reveals uncertainty, with shooting star candlesticks appearing three times. The key resistance level is at $1.072. If the price surpasses this area, we might see a pullback to $1.078, supported by the Ichimoku cloud.
On the other hand, if the EUR/USD bears push the price below the $1.067 support, the downtrend is likely to continue.
USDJPY Eyes June High at 158.2

Solid ECN - The USDJPY is currently in a strong bullish trend, with the next target likely to test June’s high at 158.2.
The MACD indicator is signaling divergence, while the Demarker indicator is declining below the oversold territory. These developments in technical indicators suggest the Japanese yen might recover some of its losses. If the price dips to the lower line of the bullish flag, this demand zone, which aligns with the Ichimoku cloud, offers a good entry point to join the bull market.
Key Levels to Watch in Crude Oil Trends

Solid ECN—The Crude Oil bulls are trying to maintain the price above the 38.2% Fibonacci level and the descending trendline. The immediate resistance is June 12’s high at $79.0. If the price surpasses $79, the bullish trend that started at $72 is likely to test the Ichimoku cloud and the 50% Fibonacci level.
On the other hand, the primary trend will stay bearish as long as the Crude Oil price remains below the immediate resistance. If the market falls below the immediate support at $77.3, the next bearish target will be the 23.6% Fibonacci level at $75.8.
Gold Prices Climb as Investors Eye Fed Moves

Solid ECN—Gold prices rose to approximately $2,313 per ounce this Monday. This increase came after a drop in the last session. Throughout this week, investors are keenly observing a range of economic updates and statements from Federal Reserve officials. These observations will help them understand when the Fed might reduce interest rates.
Essential data on US retail sales will be released today. Additionally, this week will feature updates on weekly jobless claims and Friday’s flash purchasing managers’ indices. These reports are crucial as they provide insights into consumer spending and the overall economic health.
Philadelphia Fed President Patrick Harker mentioned on Monday that, based on economic forecasts, the Fed may cut its benchmark rate once this year. Traders await further comments from other Fed officials, like New York Fed President John Williams and Richmond Fed President Tom Barkin.
Eastern Tensions and Market Forces Propel Oil Futures

Solid ECN—On Wednesday, WTI crude futures maintained a price of around $80.3 per barrel, their highest in seven weeks. This spike is due to increasing conflicts in Eastern Europe and the Middle East, which have raised concerns over oil supply disruptions.
A Ukrainian drone attack recently set an oil terminal ablaze in a key Russian port. Concurrently, tensions escalate as a senior Israeli official predicts a looming full-scale conflict with Hezbollah in Lebanon. Furthermore, oil prices gained support from strong global demand projections for the latter half of the year by entities like OPEC, the IEA, and the US EIA. Key OPEC+ nations, including Russia and Iraq, continue to stick to their production limits.
Additionally, Saudi Arabia has expressed readiness to adjust its oil output depending on market needs. In contrast, recent data indicates a rise in US crude stocks by 2.264 million barrels last week, contrary to the anticipated decrease.
Gold Prices Steady Amid Economic Slowdown

Solid ECN—On Thursday, gold prices were stable at around $2,330 per ounce due to weak US economic data, raising hopes that the Federal Reserve might lower interest rates soon. Recent figures indicate that US retail sales have stagnated, reflecting a decline in consumer enthusiasm.
This spending slowdown, combined with less tension in the labor and price sectors, has led the Federal Reserve to wait for more evidence of diminishing inflation before potentially reducing interest rates later this year. Austan Goolsbee, President of the Chicago Fed, praised Tuesday’s latest consumer price inflation figures as “excellent” and remained hopeful about continued easing inflation.
Investors are now looking forward to this week’s jobless claims and the upcoming purchasing managers’ indexes on Friday to gain further insight into consumer behavior and overall economic health.
MACD Signals Potential Shift for EUR/USD Pair

Solid ECN—The EUR/USD currency pair is correcting some of its losses from Friday. The MACD indicator shows divergence, suggesting the market might enter a consolidation phase or experience a trend reversal. Currently, the pair is in a downtrend, trading within a bearish channel and below the Ichimoku cloud. Due to the MACD’s divergence, the price might rise to test the upper band of the channel and the key resistance level at 1.076.
The price must stay below the critical resistance level of 1.066 for the downtrend to continue. If this happens, the key resistance level 1.066 will likely be tested again.
However, if the price breaks above 1.076, the upward momentum from 1.066 could aim for the 1.078 resistance level.
GBP/USD Pullback: Key Levels to Watch

Solid ECN—The GBP/USD currency pair fell below 1.267 on June 20. Currently, the pair is trading around 1.265, pulling back from June’s all-time low of 1.262. The DeMarker indicator predicted this pullback, as it hovers below the 0.3 line, indicating oversold conditions.
The immediate resistance level is at the 23.6% Fibonacci retracement level, the 1.267 mark. If the bulls push the price above this level, it could rise to test the 75-period simple moving average on the 4-hour chart, a level supported by the Ichimoku Cloud.
On the downside, the price must stay below the cloud for the downtrend to continue. Additionally, the U.S. dollar must fall below the immediate support level of 1.262 against the pound sterling.