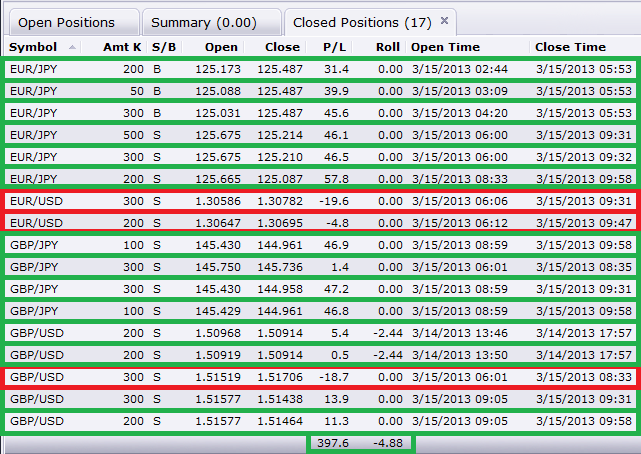
We decided to close positions on all trades and not leave any positions open over the weekend because of initial price movement upon hitting the D points and current support levels that have been reached. During our trades the EU spiked and faked us out during the 8:30 news release and the 8 hour close. In effect we had closed out the GJ and GU trades throughout the spike, added additional lots to the EJ because of price action during the close. In addition, the USD/JPY showed a clear break of the flag for YEN strength with the 8 hour close which signaled us that the GJ, GU and EJ trades would be secure and that the EU failure was a recoverable loss. Bellow are the results:
Glad I got back into that AUDCHF trade, booked 70 pips overnight.
I mentioned that I got out of the trade yesterday with a small 17 pip profit. I collected myself, re-analyzed and concluded that the pattern still looked good, so I got back in. Pays to leave the emotions at the door.
TMB I notice you’ve been collecting more than 30 pips for a number of trades lately… do you no longer stick to the 30 pip a day plan? Or do you have a new rule of thumb you follow that you’d want to share?
Today has been a good day for my trades. I’m still in the AUDCHF trade since my SL was above X and did not get stopped out. Catched a nice gartley on the GBPJPY and i am also in a bullish cypher trade on the EURGBP.
At the moment all my positions add up to +350 pips today which isn’t bad at all.
But my trading plan forbids me to close the trades or change any stops until TP1 is hit so there might be a chance i get stopped out on some of those positions after all. Good training for me in patience and discipline, even though it would suck to loose 350 pips instead of gaining them.
PS. If you are getting confused. “Vinst” in the screenshot means profit in swedish and it’s in pips not $ (take away the last digit).
To be honest that is exactly one point i am missing in my plan. But i am considering to put something like this into the plan:
All open trades on the time frames 15m, 30m, 60m have to be closed before the weekend
Because when i trade patterns on the 4 hour or daily charts my stop loss is pretty big and news, and gaps do not affect the trade in a way that i get stopped out. Just look what happened to the AUDCHF. The news made price fly up but in the end structure held and pushed price down again.
Then of course this depends on how volatile a pair is but thats nothing i am putting into my plan at the moment. Still have many months of testing my plan ahead of me before moving on to the next step.
After all this has been a good week for me and my trading plan. +1076 pips this week and still have +180 pips in open trades that are running.
Still trading a micro account but if i manage to have a positive return for the next 6 months i will invest some serious money into this.
I am never looking to “book any pips” tough. The trade has to work accordingly to my trading plan and give me the profit by reaching the TP’s i’ve set or getting stopped out. No moving of stop losses or taking profit early is allowed since that would destroy my risk/reward ratio. And if i do not have a risk/reward ratio of at least 1:1,3 i will statistically in time wipe out my account.
What i did on the GBPJPY trade now though was that i had missed to take a close look at all the earlier structure which was a bit careless from my side. Partially because i am attending a course all day and trade alongside with it.
But what i saw when i reevaluated my trade is that there is a major support/resistance level around 143.900 (red line in the screenshot) and you can see price reacting to it many times on the 4 hour chart (yellow boxes).
So i closed one of my two positions, moved stop to BE and i will let my second position run until next resistance level of 141.300 or it will get stopped out at BE. We will see.
this is my first attempt at trying to find one of these patterns. Its the USD/CHF 4h chart.Also my first time posting an image so I hope it posts correctly.
Nice that you have found this thread. I cannot see any valid pattern there at the moment. Does anyone else see something there?
When you choose your X-point (starting point) of your pattern try to pick an extreme in price or at least a leg that really stands out. The X point you have chosen is in the middle of a leg.
For example if you zoom out on your 4 hour chart i would look for patterns starting with the points i’ve marked with the yellow boxes:
Allright guys, i thought i would just post a collection of basic patterns since we have many new people in here. And for all of you who are new to this i recommend you search this thread for TMB’s posts (search function at the top) and read all of his posts. He has also posted 2 videos in the beginning of the thread on how to find patterns easily.
For now i have gone back to the basics and am just trading patterns that match the rules in the patterns i post below. Additionally i am not trading crab or butterfly patterns, only cypher, gartley and bat patterns.
And since there is not much information about cypher patterns out there i made my own drawing of what a valid cypher pattern should look like. Hope it’s helpful.
Still practicing on finding these patterns and understanding them. How does this look for a possible gartley forming on the 5m EUR/JPY?
EDIT: I posted this before seeing diablo’s post with the charts. Would this be considered a bat pattern instead of a gartley, if it is even either? Sorry if these are dumb questions, I’m just really new to this :34:
For the X point you are using the only thing i can find in there is a possible bullish crab pattern. The D point of crab patterns traditionally is at the 1.618 extension level of the XA fib.
If you are using TMB’s method you get a perfect fib convergence at the 2.000 and 1.414 level. Don’t think TMB uses the 1.414 fibonacci level though.
In order for it to be a gartley, the B leg would need to retrace to the 618 of XA. What you’re looking at is a potential Bat pattern, but the CD leg hasn’t really taken form yet… C is still searching for a bottom and the D leg hasn’t established itself because it hasn’t closed above the B point.
Look at my post above for the rules of patterns. To be a gartley the B point has to be at least a 61,8% retracement of XA. In this case it is only a 38,2% retracement which possibly may form a bat pattern. If price goes below the C point you have to redraw and reevaluate the pattern though.
Finding patterns the way TMB does you have to look for convergences that happen only after the 1.000 fib lvl of the fib that you draw from B to A and move to C. In your case the closest convergence is at the 0.786 level of XA.