Good reaction from the level, but now a break of the downtrend line. I would move to breakeven.

T1 met. Might bounce here on the m1 bullish bat, but worst case now +20 pips.
Good reaction from the level, but now a break of the downtrend line. I would move to breakeven.
T1 met. Might bounce here on the m1 bullish bat, but worst case now +20 pips.
I looked up the pair and your B retraces fully to the 38.2 of XA, why have you drawn your gartley at a point somewhat below your true B?
also i think the way you draw things and i draw things are different. your first D is my B, and your second D is where I expect my D to land if the rest of the pattern forms as standard
True that TMB. I started scanning through charts its been now a month and i can clearly see potential patterns almost every time!!! I have literally turned into a pattern freak!!!
lol XD wait till you start dreaming about trades.
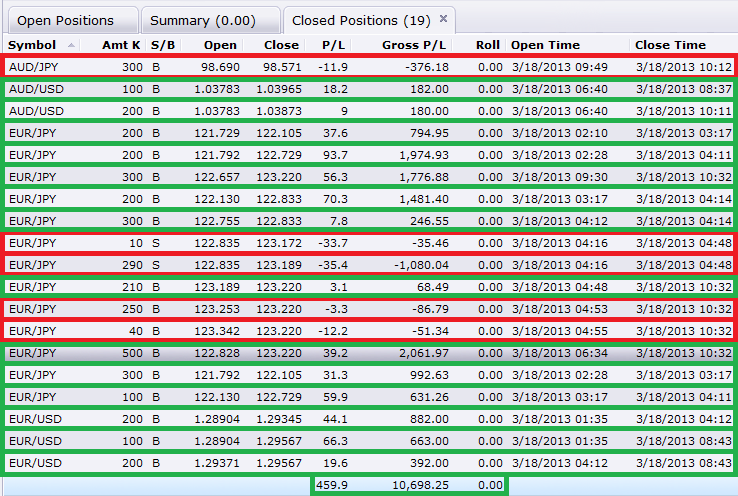
Bellow are our results for trading today’s gap. If price pulls back, we will continue to build bullish hydras in preparation for the break of the highest high on the 5 min. If price breaks, we will long the ej for 70-200 pip depending on price action once certain s/r points are reached. Anyways, bellow are today’s results anything else would simply be a bonus and tomorrow during London session we will post our analysis. Today’s daily bar is a VERY important close.
Haha, i’m already there. Don’t know if it’s a good or bad thing. 
what patterns were you trading today.
i didn’t notice anything, apart from that possible one someone pointed out here. there was not much high impact news scheduled today at all
i didnt notice any patterns but then again, i mainly browse the hourly, and m30 timeframes. perhaps patterns were forming on other timeframes?
As always incredible results TMB, good job!
I understand the function of your MSRT lines and i understand how you use them. As i’ve tried applying them on my own i get really confused though. I’ve read your posts about them but i still do not get the whole picture for some reason.
Based on which rules do you draw them? Let’s say you are about to trade a 1 hour chart. Do you draw your MSRT lines on the 4 hour and daily then?
Which crossings of MVA do you use and how do you know when not to use one?
I just for fun took the EURUSD (see screenshots below) now and on the 4 hour chart there are about 12 crossings of MVA’s within the last month. I drew a bunch of MSRT lines from the crossings that would end up in the area price is at the moment and i only used the last crossings for the second point of the lines. But as you can see it results in a lot of different lines and i could theoretically draw in a hundred lines. How do you decide which ones to use and/or not to use?
I do not know which ones to look for and which ones i should ignore and i think many of us in here encounter the same problem.
I remember you wrote that you look for lines that have been respected by price in the past. How many times do the lines have to be respected in the past before being a valid MSRT line in your eyes?
Would be grateful if you can give me some insight on how you chose and validate your lines since i really am interested in learning it in detail.
Funny… I’m seeing patterns everywhere today… lol. Well here is one of the main ones:
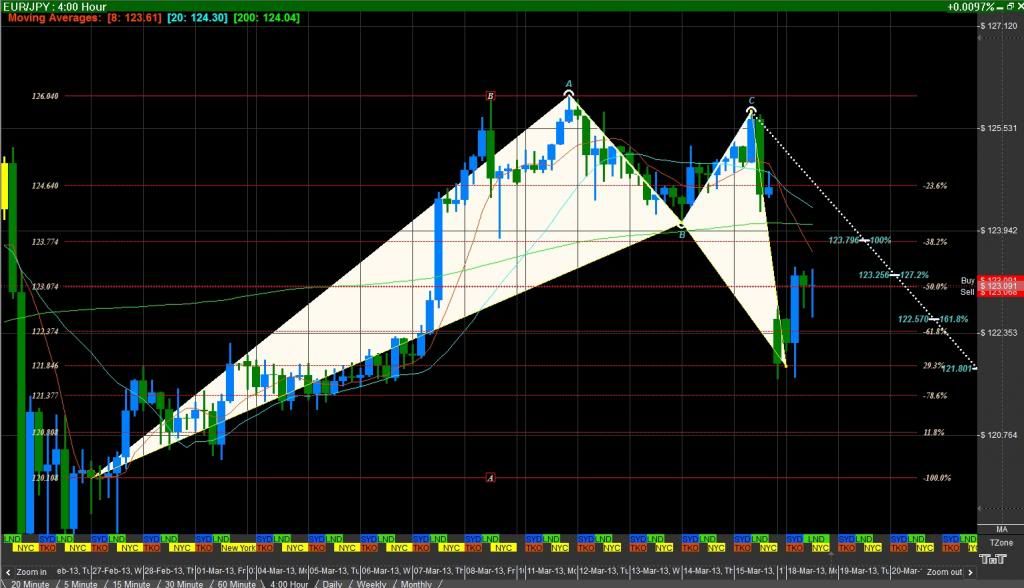
Bellow we have a bullish gartley that triggered yesterday during market open. Where 200% CD converged with the .707 of XA for the 4h/8h charts (X = 120.357) and our initial entries where based on the retest of this convergence zone today at 2am est.
BTW if you look at the yen pairs and the eu, there are patterns developing within the range in the 5 min chart for 25-50pip targets.
please share with your images for learning
I’m working on some new tutorial videos where I will go fully in depth with the MSRT ;). If you want, ill take requests on what else you or any one else would like to learn.
thanks for your trying
Awesome, that would be really helpful since i think you got a lot of stuff going on in your head while trading that never really makes it into your posts. 
I guess thats one reason why everyone has to create his or her own trading style and plan because it becomes very personal.
Tell me if there is anything i can assist you with to get your videos or some other info together.
Hey TMB.
Building hydras and your take on targets and stops, is definitely two tutorials i would like to see you doing.
Hi, TMB,
A newbie pattern trader here (not a newbie trader though). I have been reading the posts on this forum for three weeks now. I love your trading style, analysis, of course, your results. Thanks for planning to make the MSRT tutorial video, which will certainly help us tremendously.
I noticed that most times you trade 1H/4H patterns. But sometimes you have multiple entries in the directions presumably big patterns indicate to you. Are those multiple entries based on patterns in smaller time frames, such as 5M/1M? Or you have those entries based on pullback length, minor resistance/support and/or your intuition? By looking at the result you posted today, I understand you traded multiple times of EJ because of the bullish 4H gartley pattern you showed us. But what are the reasons you entered long positions on eur/usd pair? I am sure you have your MSRT/other analysis to support the trades. Does the belief that gaps are created to be filled have any impact on those trades?
Thank you very much!
am already there too buddy, and sure a good thing 
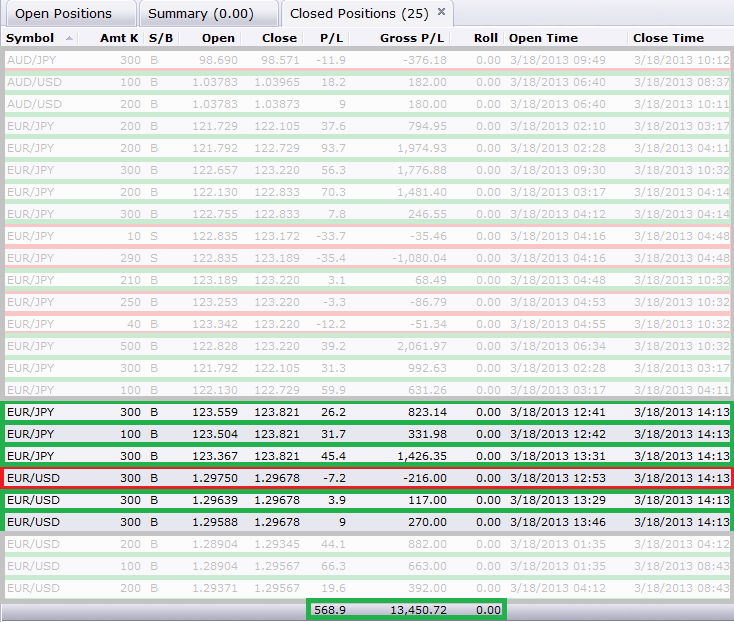
Bonus Pips:
As my mentor told me long ago, but didn’t realize until years later… harmonic patterns are simply a major, but important tool in your tool box. I use patterns developed on the higher time frames to scalp major spikes in the market such as to day with very tight stops (both visual and physical). In addition once price spikes from a major D point, price tends to consolidate and allows me to swing trade the pair for 20-60 pip targets or build positions within the flag for continuation of the predicted reversal. And yes, I do use patterns that develop in both the 1 minute and the 5 minute charts in order to place my entries for the hydra and or figure out where my exit for a hydra would be; I also practice trading the 5 minute patterns at its extreme points within the range to swing trade price as it flags within a major D point; while at the same time taking into account the main direction of the trend to distribute lot sizes for the buy or sell (note that I attempted to short the EJ today after reaching a take profit zone, but only used 8% of my max lots for the trade while at the same time keeping the EU long positions to simulate a hedge in case of continuation). As for the EU, it gaped past the daily pattern it had previously respected and found a major S/R zone that is the retest of a monthly triangle and head and shoulders that was broken with 1.3k pip apex which only had moved price 600 pips up from its original break. In other words, the push down is a retest for continuation of the uptrend (it was also converging with MSRT points). Do I believe gaps are meant to be filled? I believe a to think this way in Forex markets is EXTREMELY dangerous because unlike other markets like stocks which tend to fill in the gap by the end of the day, forex markets have been known to shoot past the gap without testing it for months… a very dangerous game to play in my book. I do believe however that gaps lead towards great trading opportunities in the markets for both ranging and trending and there are multiple techniques that I have discovered to trade them. Thank you for your questions I’ll definitely elaborate on them within one of my videos and I look forward to see you around in this thread :).
-peace- I’m freaking tired lol time to chill and sleep for tomorrow.
[QUOTE=TMoneyBags;470292][B]Bonus Pips:[/B]
Thank you for your questions I’ll definitely elaborate on them within one of my videos and I look forward to see you around in this thread :).
Hi, TMB,
Thank you for your explanation and analysis. I saw EU price went gap-down to the head and shoulder trendline on the weekly chart as you mentioned. But how did you come up with the number 1.3K pip apex based on breaking of weekly HS trendline? Is that based on a potential bearish gartley formation with major D at 78.6% retracement on the weekly chart? If the retest of the trendline turns to be a success, do you imply we will see a big bull market in EU with eventual target of 1.43 range?
After reading all your posts, it gives me an impression that you are a short term trader based on a longer term chart pattern. Am I right? Price never goes straight to the target if there is one. It always zig-zags. Once you are 80-90% (the rate of success of those patterns as you mentioned) sure about the direction and target of the market, you take full advantage of the peaks and troughs along the way to make more profit by trading it, and in the meantime, to reduce the risk of holding it? Correct me if I am wrong.
Thanks,
cant wait for the videos!!!
I am usually looking mostly on the 30 minute and 1 hour timeframe.
so you are looking on the 4 hour time frame and daily time frame and if you see a pattern developing you will sometimes scalp it?
how do you decide weather or not to run the risk of scalping it? many times on the 1 hour or 30 minute timeframes i see very encouraging gartleys forming …but a great deal of a time they blow out and invalidate themselves before they get to the next point. when scalping on higher timeframes how do you decide weather or not to run the risk of scalping. and where do you place your stop losses?