Strategy #3
By far the safest and highest win rate of all my strategies. This started from strategy number 2 and added some filters to increase the probability of success. The result is a high winrate and low drawdown system. The downside is that the trade frequency is very low. This backtest is over 11 years and only places 65 trades. This would need to be part of a series of bots in a portfolio rather than 1 system to trade constantly.
When I have a spare £1k, I will be putting this system into play.
I found afterwards that the backtest doesn’t match reality if you use the server bars rather than tick data. I have no idea how that makes sense because it was calculating at bar close, so the bar and tick should have the exact same information at the point, but hey ho, that’s what happened… Testing with tick data and the performance wasn’t great… Back to the drawing board.
I’ve been watching @AmericanTrader thread for a while and was impressed by an indicator he used that is I believe doing a slow Hodrick Prescott filter onto a fast Hodrick Prescott filter and creating a channel. I’ve had success in creating channels out of moving averages, but they’re not very smoothed and can end up being too wide if you use a long period.
I managed to find the maths behind the indicator and replicated it into a Ctrader indicator. The problem with automating and this indicator is that I can’t see what the channel looks like at the time a trade was taken because it redraws every candle. So I changed the channel to only draw the HP filter value for the last candle and then I can see where price was relative to that at the close of every candle. This helps visualise the market and allows me to try and find patterns.
There’s lots of ways this channel looks like it can be traded. I started simple with trading channel extremes and several things were winners, but most went through long periods of going nowhere.
I’ve long thought that analysing the market on a closed bar and making a decision is somewhat crude and difficult to know if the next candle will continue or reverse. Placing orders seems to have some big advantages, the main one being that if price goes the wrong way to my analysis, I don’t get into a trade and don’t take the loss. So I put a combination of fast and slow filter to place orders when price is moving in a direction and if it moves away from me, I move the order until price eventually moves the way that the analysis says.
This strategy also allows hedging, so I can be in a retracement position and a trend position at the same time and both can close in profit. There is no SL or TP, the system decides when to close all trades, I think this could be modified but so far it seems to work.
Backtesting V1 of the strategy (with tick data aha) shows a pretty good win rate and long term profitability over more than 3 years of market data.
I found systems with revised entries that give much higher win rates, but they only trade a couple of times a month and that’s not what I’m looking for right now. However I will be looking at pursuing these on multiple instruments in the future.
Yesterday, I set this into action on a real account with the same settings as shown in that back test.
So far, so good. I’m well aware that today was very much perfect conditions for this and there will be much slower spells, but I’m happy that performance exactly matches the backtest for this data, so suggests it has potential.
1 Like
Last week was the trial and this week it’s on a new account to track progress of this system. Not quite as profitable as last week, but still very good performance.
I did have to make a slight alteration to the algorithm when I noticed it kept opening positions and closing them almost immediately at a small loss. I hadn’t stopped it from opening a position if the closing criteria was true, so added that condition in. Backtesting shows a slight improvement to the results.
Week 1 Results:
Easier graph to see progress on MyFXbook
This is just following my channel trading strategy. Soon, when I can close all positions in this system, I will add a second bot trading on the account with also very good win rate. This way I have to track which positions belong to which system.
So far 8.62% return in 2 weeks. If I hadn’t interfered and let the system do its thing, it’d be triple that.
I’ve now added multiple systems into this account all trading simultaneously. Found a bug where one wouldn’t place orders because another system had orders open so this week has missed out on the original system doing anything.
Backtests for the 3 systems are shown below starting in April 2020 until today with tick data. There’s no optimisation run on these, so overfitting shouldn’t be a risk.
System 1
This is a system that trades retracements. I guess a mean reversion type system. When the 30 day high/low is broken, a position is taken back towards where it came from. Unspectactular results in that the return is only 40% over a long period. I only added this because the drawdown is fairly low and it allows more use of capital. This will be the one to get cancelled if I run out of margin.
System 2
Based off Larry Williams smash days with some tweaks to the rules. 278% return over 5 years. This is with a 1% risk to the account per trade. If I increase that to 2%, the system takes off exponentially.
System 3
Based off a fast and slow HP filter to take trades in the trend direction after a short term retracement. There’s a couple of nasty drawdowns in there, so I’m not 100% happy with it, but 455% return would be exceptional performance.
All of these systems are compounding, so it’s hard to say what the final account gain would be since I can’t back test all 3 together, but it would be much greater than 1000%. But past performance is no indicator of future gains, so let’s see where this goes…
About 2 months into the account. Here’s the progress of the 4 strategies.
System 1 (EURUSD with HP filters)
Return to date +32.4%
System 2 (FTSE Retracements)
Return to date +6.1%
System 3 (Smash Days - sort of)
Return to date -3.3%
NB. This system has been disabled until the markets stabilise. These entries were not bad, but the extra volatility caused the stop loss to be hit before moving in the direction that was expected. We’re in a market correction, possibly heading to a bear market, this system favours bull markets.
System 4 (HP filter retracements)
Return to date +2.7%
Total return for the last 9 weeks +37.9%. Not all of these systems were trading from the start, some have only been going for about 4 weeks. Pretty happy with that return, it certainly beats my manual trading over that time.
1 Like
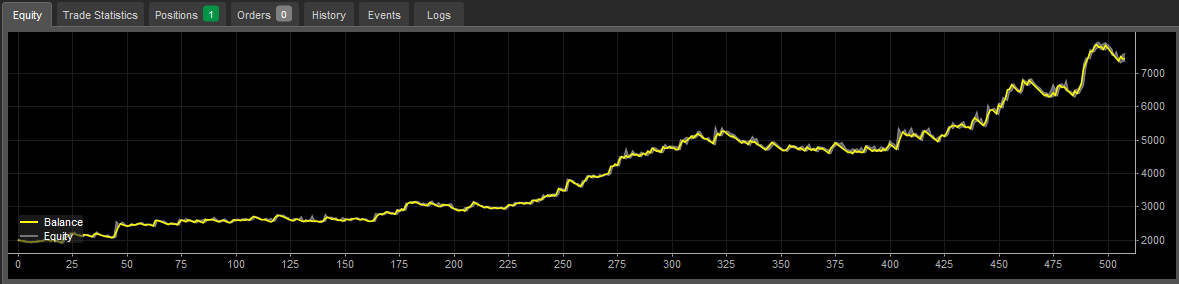
A combined chart of these strategies and running balance
I wish I did manual trading in a separate account. Analysing this is more work than I’d like.
1 Like