Here’s how AUD/USD traded yesterday:


Very helpful mate!
Thanks, mate! Hope this helps in your trades!


Holla, comdoll brothas! It’s been a while, but I’m back! Here’s what happened to AUD/USD last Friday.

AUD/USD during the recent week was in a Down trend that sellers were successful in achieving the lowest price of 0.92273. Currently in daily time frame price with touching the ascending trend line (made of 4 price levels) and forming a bottom price has prepared a field for ascending. (sellers used this level to leave their trades).Right now price in short time frames such as H4 and H1 is above 5-day moving average and warns about price increase in short period of time.
As it is obvious in the picture below, between the top price of 0.94600 and bottom price of 0.92273 there is AB=CD harmonic pattern with ratios of 38.2% and 224% that warns the potential of ascending from the D point of this pattern.Stoch indication in Daily and H4 time frame is in saturation sell area and with the next cycle confirms the 5th point of ascending trend line and warns about ascending during the next candles. Generally according to the current situation, until the bottom price of 0.92273 is preserved, price has the potential for reformation of downtrend.

As it was mentioned in the previous technical analysis of AUD/USD pair dated 2014.04.29, according to the formed signs, there was a potential for ascending of price which finally happened .Buyers were successful in reaching to the highest price of 0.95000.In weekly time frame of this currency pair there is no clear reason for ascending of the price and the price by being under the 5-day moving average and also descending cycle of Stoch indicator warns more descending of next candles .According to the formed price movements, RSI indicator is in saturation buy area and in divergence mode with the price chart that confirms the top price of 0.95000 and warns about changing price direction.
Currently one of the important warnings for starting the price downfall is breaking the support level of 0.93281 in daily time frame because As it is obvious in the picture below, there is an AB=CD harmonic pattern between the top price of 0.94551 and the bottom price of 0.933281 with ratios of 50 to 161.8 that warns about ascending of price from the D point of this pattern.
Technical Analysis of AUD/USD dated 2014.07.16

AUD/USD during the recent days was in a strong and consistent downtrend that sellers were successful in achieving the lowest price of 0.85529.Right now price in long time frames such as monthly and daily is under 5-day moving average and warns about price decrease in long period of time.
As it is obvious in the picture below, there is a harmonic butterfly pattern between the bottom price of 0.85529 and the top price of 0.89109 that there is a potential for changing price direction from D point of this pattern. Stoch indicator is in saturation sell area follows the bottom price of 0.85529 and warns the possibility of ascending during the next days.Generally until the bottom price of 0.85529 is preserved, the price has the potential for ascending in this currency pair.
Technical Analysis of AUD/USD Dates 2014.11.06

Liking it dude. I look forward to concentrate on this pair. I have lost money trading different pairs and I have not been able to master them all. U made a point Gee.
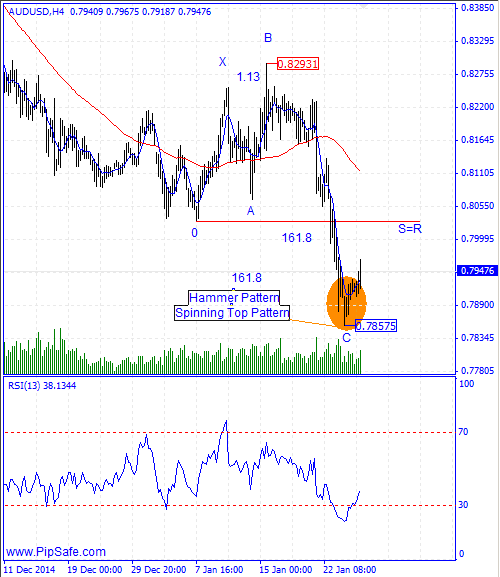
AUD/USD was in a strong and consistent downtrend during the recent days that sellers were successful in obtaining the lowest price of 0.78575.This bottom price has stabilized by closing of yesterday ascending candle (Daily Chart) and it is the nearest supportive level.
According to the formed price movements in the chart, there is a Shark harmonic pattern between the bottom price of 0.78575 and top price of 0.82931 that warns about ascending of the price with completion of this pattern ending point.
In daily and h4 time frames RSI indicator is in saturation sell area and with the next cycle confirms the bottom price of 0.78575. Generally according to the current situation, until the bottom price of 0.78575 is preserved, there is the potential for ascending of price and reformation of descending trend.
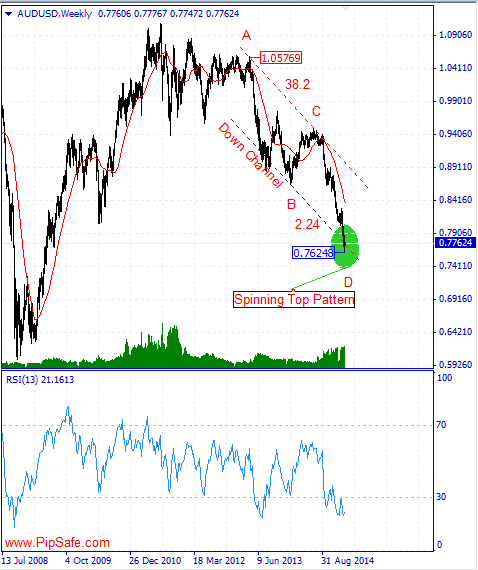
AUD/USD was in a strong and consistent downtrend during the recent weeks that Sellers were successful in obtaining the lowest price of 0.76248. As it is drawn in the picture below, according to the type of price movement, price is in a Down Channel that Sellers use the supportive edge of that to leave their trades.According to the previous week changes, previous week candle was closed as Spinning Top candlestick pattern which shows vulnerability of descending trend and potential for formation of a bottom price in this range.
As it is obvious in the picture below, between the top price of 1.05769 and bottom price of 0.76248 there is AB=CD harmonic pattern with ratios of 38.2 and 2.24 that warns the potential of ascending from the D point of this pattern. RSI indicator is in saturation Sell area and confirms the current bottom price, also wars about formation of a Bottom price. Generally until the Bottom price of 0.76248 is preserved, price has the potential of ascending.
Technical analysis of AUD/USD dated 18.03.2015
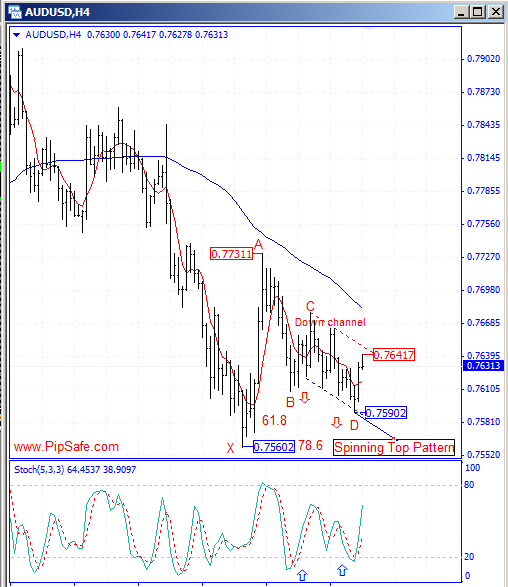
AUD/USD during the recent week was in a strong and consistent Downtrend that Sellers were successful in achieving the lowest price of 0.75602. As it is obvious in the picture below, there is an ideal Gartley harmonic pattern between the top price of 0.77311 and the bottom price of 0.75902 that there is a potential for ceasing of price from D point of this pattern.
Stoch indicator is in saturation Sell area and it is in divergence mode with the price chart that warns the potential for changing price direction. Generally according to the formed sign in the price chart until the bottom price of 1.75602 is preserved, the price has the potential for ascending in this currency pair and the first warning for ascending of price is breaking of the resistance level of 0.76417.
Technical Analysis of AUD/USD dated 09.04.2015
AUD/USD on 02.04.2015 by creating the ideal bottom price (formation of hammer candlestick with candle confirmation) has started to ascend and could record the top price of 0.77378.Right now in daily time frame price is above 5-day moving average and warns the potential of ascending of price during the next days(Long term time) .Price has formed a top price (Evening star pattern) with reaching to the specified resistance levels in the picture below and it has stopped from more ascend and has started a little descend with shows exit of some buyers from their trades.
As it is obvious in the picture below, between the bottom price of 0.75327 and top price of 0.77378 , there is AB=CD harmonic pattern with none-ideal ratios of 61.8 and 127.2 that with completion of the D point , there is a warning for stopping of uptrend and changing price direction.RSI indicator is in saturation buy area and in divergence mode with the price chart confirms the mentioned top price and warns about changing price direction.The first important warning for ascending of price is breaking of the 0.77378 resistance level(R1 of Pivot Point or D point).

AUDUSD will go up? Now, Im waiting for resistance test and break it. Chart looks up from support bounce


0.7218 critical level for AUD/USD strength Mahony continues by expressing the possibility of a possible short-term bounce after the current downtrend, but not towards the highs experienced previously, with the AUD following the 61.8% Fibonacci line. However, Mahony finishes by commenting that if the AUD breaks below the 0.7218 level, there could be a significant sell off, with the outlook potentially becoming very ugly.
See more at: Forex focus: What’s the impact of a lower AUD on markets? - Tip TV