Your still alive,
I just took equal amounts of profit and loss late USA and place minimum amount 6711
Your still alive,
I just took equal amounts of profit and loss late USA and place minimum amount 6711
Yes, still in there. AUD still bottom of my ranking so good for a short but disappointed the USD has weakened alongside it.
Still, I suppose with a new banking crisis in progress some unexpected price action is to be - expected.
Yes lots of indecision,weak data and market fluctuations
Abit of bear activity,
It’s FOMC statement s 6:00pm weds so there could be breakouts of the range this week.
I go as far as 6790 ,as I’ve profited on the range over the period
It peaked on IG 6759.4 on IG ,
Won’t you still consider a short in the near future then or dosent it fit the criteria now?
Wednesday 22/03 - Short stopped out this evening.
Will review what’s next tomorrow.
I took around 75% of trade off the table Tuesday evening.Around 0 Monetary (winners/losers).
Got a small trade 6730 now but overall slightly in the red for now
I’m out of my short on this pair but I still rank it as a short target. But its only a Weak Sell right now as the weakness of the USD has pushed it down the ranking table towards AUD eliminating the differential, and we have no less than 5 overlapping weekly bars.
But Wednesday’s bar printed a putative swing high and a close below Wednesday’s low would get me in short again.
Late update on Friday 24/03 -
As had hoped, price closed below the low of the putative swing low bar of Wednesday 22/03 and confirmed the short entry set-up. I am now again short AUD/USD.
In fact the chart gave me two others of my short entry set-ups on Friday - price broke down through the bearish fractal of 21/03 and closed below the Inside Day of 23/03.
My issue with being short here and now is that the USD has gone so weak. What are they doing over there? Do they know?
Another week has gone by and achieved little for this pair except a good exercise in patience.
I have this as a Weak Sell only, as the major USD charts are 6 out of 7 bearish and the last 6 weekly bars overlap. The lack of trending is demonstrated in other ways too - the 20EMA threads most of the last 15 daily bars, multiple fractal signals have either not been triggered or have been but remain in the red, etc.
My entry point is pretty far south to avoid volatility in the current range but to catch a firm bearish break-out - a bearish fractal entry below the low of 24/03.
Have a nice weekend.
(I’ve had a stomach bug for 48 hours but do you know what? - I feel fitter now than before I was ill - having had an enforced rest, no meals for one day and lots of extra sleep. Happy days!)
I’ve been watching this pair, wondering if we’re going up or down. Overall trend is down and I have a feeling we might see a break out of this consolidation soon. Here’s what I’m seeing:
Too risky for me right now as it could go either way, but my bias is short.
My chart has, like probably most folk’s, the same channel marked. I don’t have any particular directional bias, but if it doesn’t remain in that channel much longer, and breaks downward, I will be looking for a pullback to the trend line to go short.
Power indicator demonstrates,
BULL power increasing
Bear power reducing
Daily candlestick trending along BULLISH channel.
March High : 0.67378
March Low : 0.65642
Mean level for March
= (0.67837+0.65642)/2
= 0.66739
Current price for AUDUSD is trading ABOVE
March mean level : 0.66730
Immediate resistance :
Week High : 0.67400
A breach of this resistance level should propel prices
ABOVE 0.68000 at the very least.
Unless, price breakout below the bullish channel, and goes below 0.66500.
AUDUSD remains bullish.
Another reason to proceed with caution, there will be a lot of people trading this.
And back up we go. Anyone trading this channel would have made out like a bandit.
Tuesday 04/04 update -
I was thinking on Monday night that I had missed the bullish bus and over-focused on following a non-existent downwards bias. However, bullish though Monday’s bar was, the market is not following through. We saw a lower close on Tuesday, and price is falling even more rapidly today.
But all evidence is still evidence, everything on a chart says something. So Monday’s outside range bar could be very useful here. It offers new definitions of the trading channel with its widely separated high and low. I have a sell just beneath the bar with stop-loss just above as all else concerning this chart and AUD looks bearish. But its valid also to put a buy just above the high with a stop just below the low. If price breaks out of the coiled spring tendency, it could move quickly. Which is one of the beauties of trading this pair as opposed to EUR/USD for example, and other majors.
Have a good day.
There was an RBA Interest Rate announcement at 2.30PM (GMT+10) Tuesday in Australia.
After ten months of consecutive rises… No change… 3.6%… Rates are biting hard…
Rate was predicted to hold at 3.6%…
AUDUSD goes up if Interest rate is increased… AUDUSD goes sideways if interest rate is held… AUDUSD goes down if the rate decreases…
The USD is getting smashed this month, just not as smashed as the AUD yesterday.
Rate announcement is the first Tuesday 2.30PM (GMT+10) of the new month.
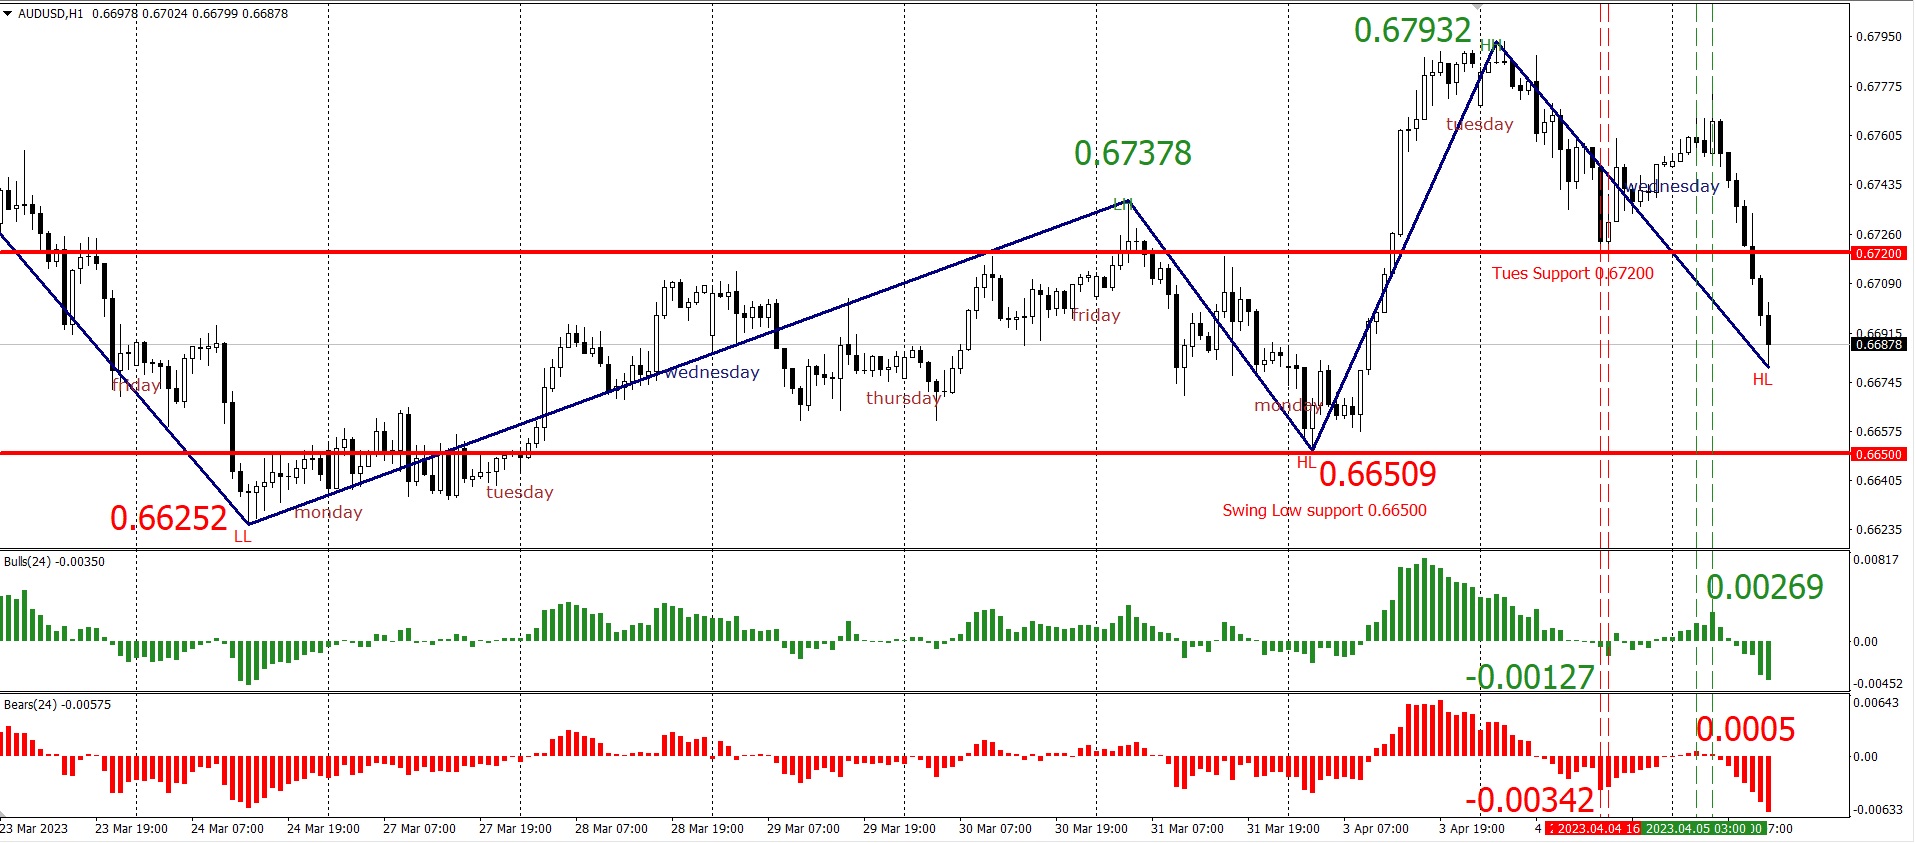
Despite the fact that the support level (0.67200) for Tuesday’s daily low has been breached and the time price chart indicates bearish momentum, with the immediate hourly candlestick making NEW Lows, my opinion is that the main directional bias should be bullish based on the Swing Theory. This is due to the presence of a series of LL, HL, LH, kk from a larger weekly perspective.
Lower Low (LL) : 0.66252
Higher Low (HL) : 0.66509
Lower High (LH) : 0.67378
Higher High (HH) : 0.67932
No doubt, when comparing the Bear Power TROUGH (-0.00342) with the Bull Power TROUGH (-0.00127) at 1500hr and 1600hr respectively, it can be observed that the Bear Power is Stronger.
And, it is also evident that the Bull Power is weakening when comparing the Bear Power PEAK (0.0005) with the Bull Power PEAK (0.00269) at 0300hr and 0500hr respectively.
Taking a bearish stance wouldn’t be wrong.
IMHO, unless the support level (0.66500) for Swing LOW is breached, AUDUSD remains bullish.

Hi @alphahavoc - This is all good stuff. As you will have gathered I am no longer in the TA camp which holds that signal X means market Y is going down. Rather the one that says that as all my bearish criteria align, if price goes down to/past here, I would rather be short, and if it doesn’t I would rather be in cash.
Of course, AUD/USD fell off my sell list as soon as it closed above the 50EMA. But for the purposes of this strategy, it won’t be a trend-following buy for ages yet. That doesn’t make it not a buy for other strategies, especially given the power of Monday’s bar.
Coincidentally I’ve been looking at Larry Williams’s Smash Day Strategy, and this set-up clearly qualifies. Simple, worth a look.
Just finish reading up on Larry Williams’s Smash Day Strategy
I concur, it’s definitely worth a read. The strategy is sound and straightforward. From my personal perspective, I would suggest incorporating a filter for Larry’s smash with a breach of 5 daily High/Low to confirm a trend reversal.
Unwittingly, I may have been adopting a similar strategy for quite some time now. Thanks for sharing.