AUDCAD Technical Analysis November 3/2019
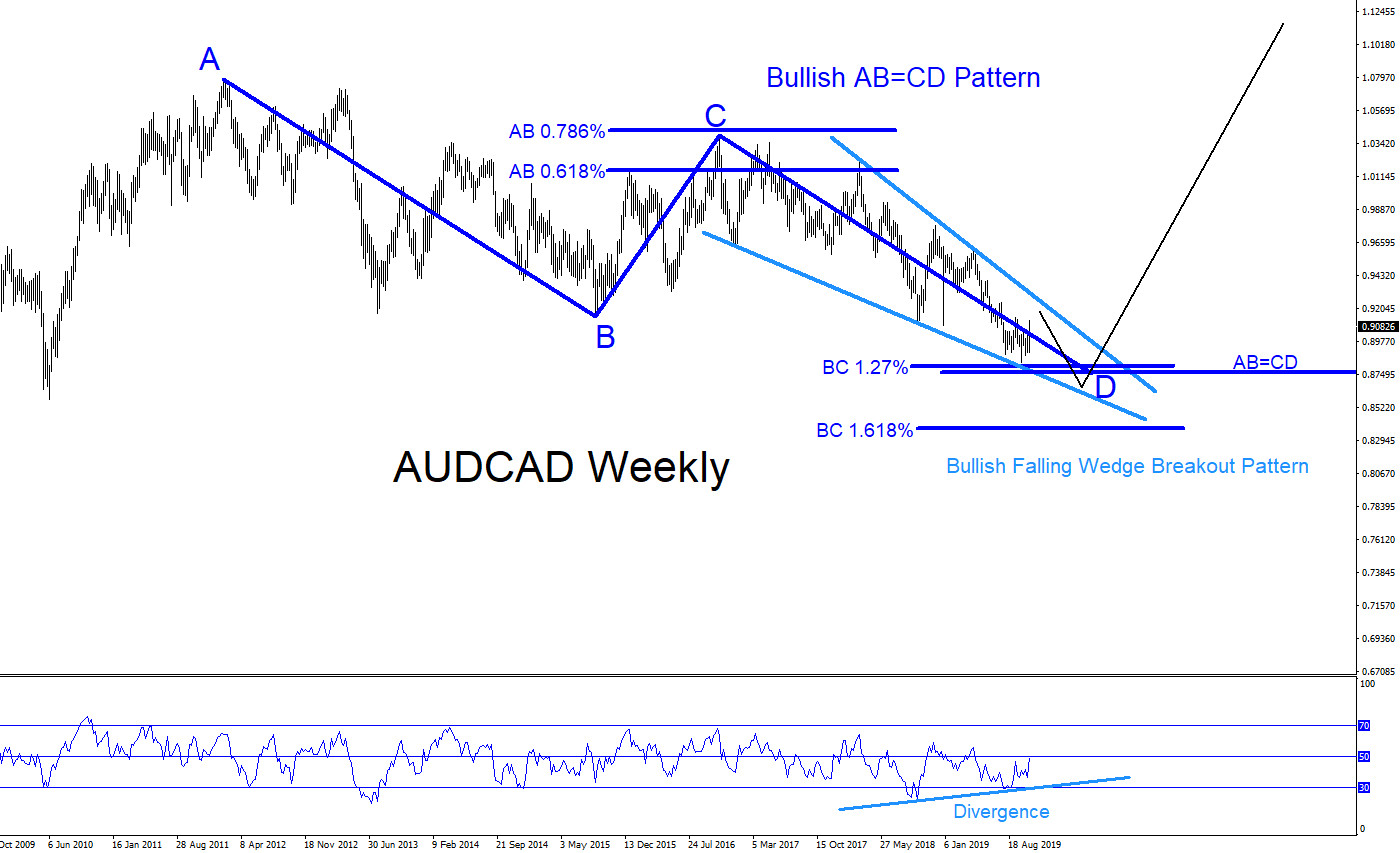
AUDCAD : There are clear visible bullish market patterns on the weekly chart but traders will still need to wait for more confirmation that a bottom will form. AUDCAD still needs to make another move lower to trigger the dark blue bullish AB=CD pattern. Bulls can possibly be waiting below the 1.27% Fib. level to push price higher and possibly start a new trend to the upside. Oscillators are showing a bullish divergence so a break above the light blue bullish wedge pattern will add more confirmation that the possible reversal/bounce higher has started. If AUDCAD breaks above the wedge pattern it is possible the pair can run higher above the 2012 peak high in the next coming years. For now we should take it step by step and consider any break higher to at least target the 0.50% Fib. retracement level of the 2016 high to wherever the AUDCAD new low will terminate. We have yet to see if the pair will find a bottom and have yet to see if the pair will even respect the AB=CD bullish pattern. So for now traders need to be patient and wait to see if a bounce and wedge breakout happens in 2020.
AUDCAD Weekly Chart 11.3.2019
Of course, like any strategy/technique, there will be times when the strategy/technique fails so proper money/risk management should always be used on every trade.