AUDJPY Short Term Technical Analysis
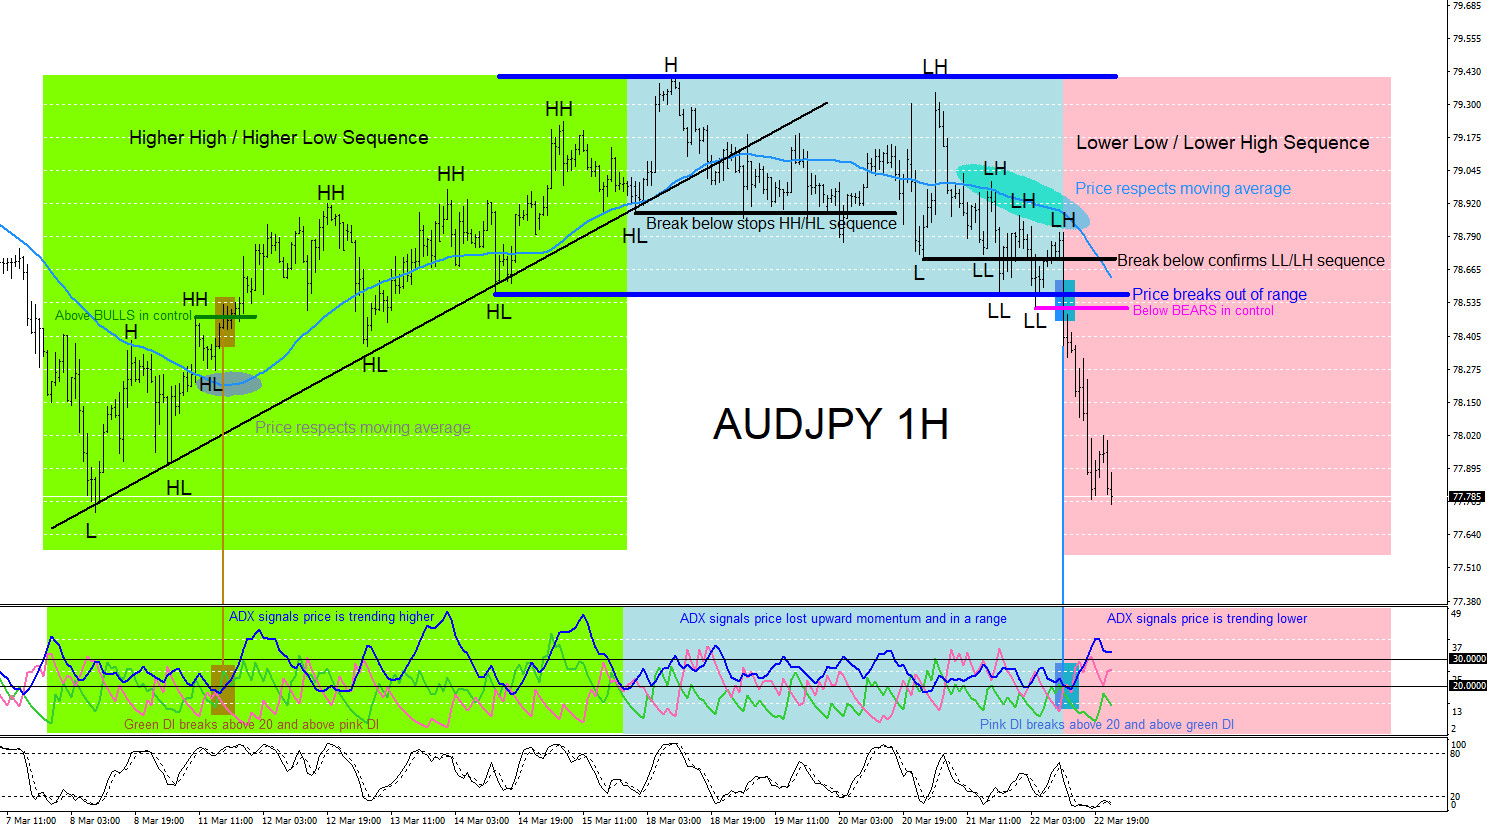
AUDJPY on March 8/2019 the pair bounced and traded higher. Price started a Higher High/Higher Low sequence and trended higher for the entire trading week of March 11-15/2019. In the chart below the ADX (Average Directional Movement Index) signalled that the move to the upside was losing momentum at the start of the new trading week of March 18/2019. AUDJPY traded lower from the March 18/2019 highs and broke below the previous HL (Higher Low) which signalled the Higher High/Higher Low sequence paused or has possibly stopped. From March 18/2019 price traded sideways in a range until March 21/2019 when a new Lower Low/Lower High sequence started. Traders at this time now needed to expect a possible reversal lower after the pair started to make Lower Lows and Lower Highs. The ADX line finally broke above the 30 level together with price breaking lower out of the range and breaking below another Higher Low level which signalled the trend reversal lower was confirmed.
AUDJPY 1 Hour Chart March 22/2019
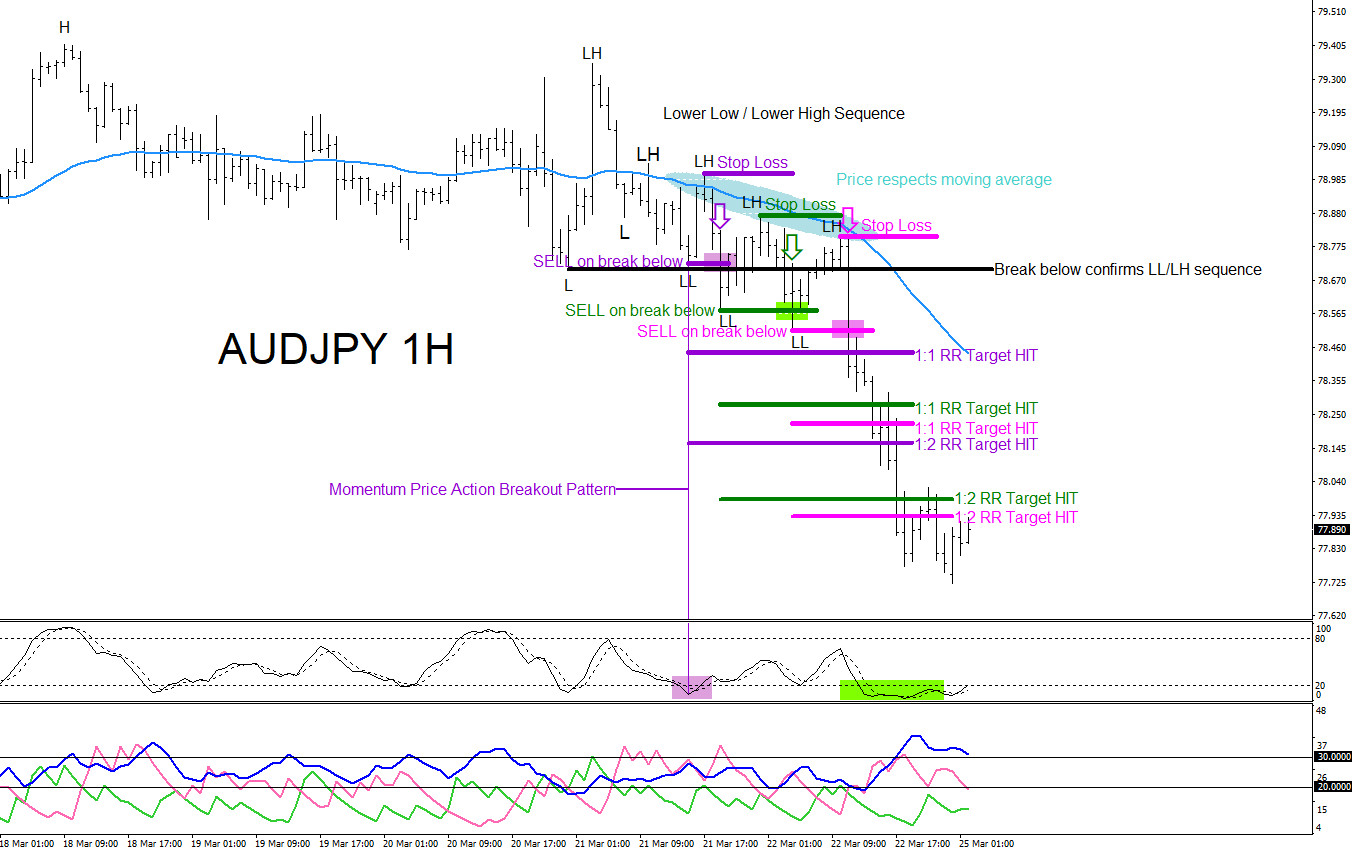
The ADX should never be used alone for trade entries but instead be used together with other trading strategies/techniques to get a better view of the market price action at that moment. Using the ADX indicator together with Momentum Price Breakouts can give traders opportunities to enter the market. The AUDJPY chart below shows multiple SELL breakout trade setups to catch the move lower. All SELL entries hit their projected targets. NOTE* Price must respect Moving Average before BUY/SELL breakout entries
AUDJPY 1 Hour Chart March 22/2019
Of course, like any strategy/technique, there will be times when the strategy/technique fails so proper money/risk management should always be used on every trade. Hope you enjoyed this article.