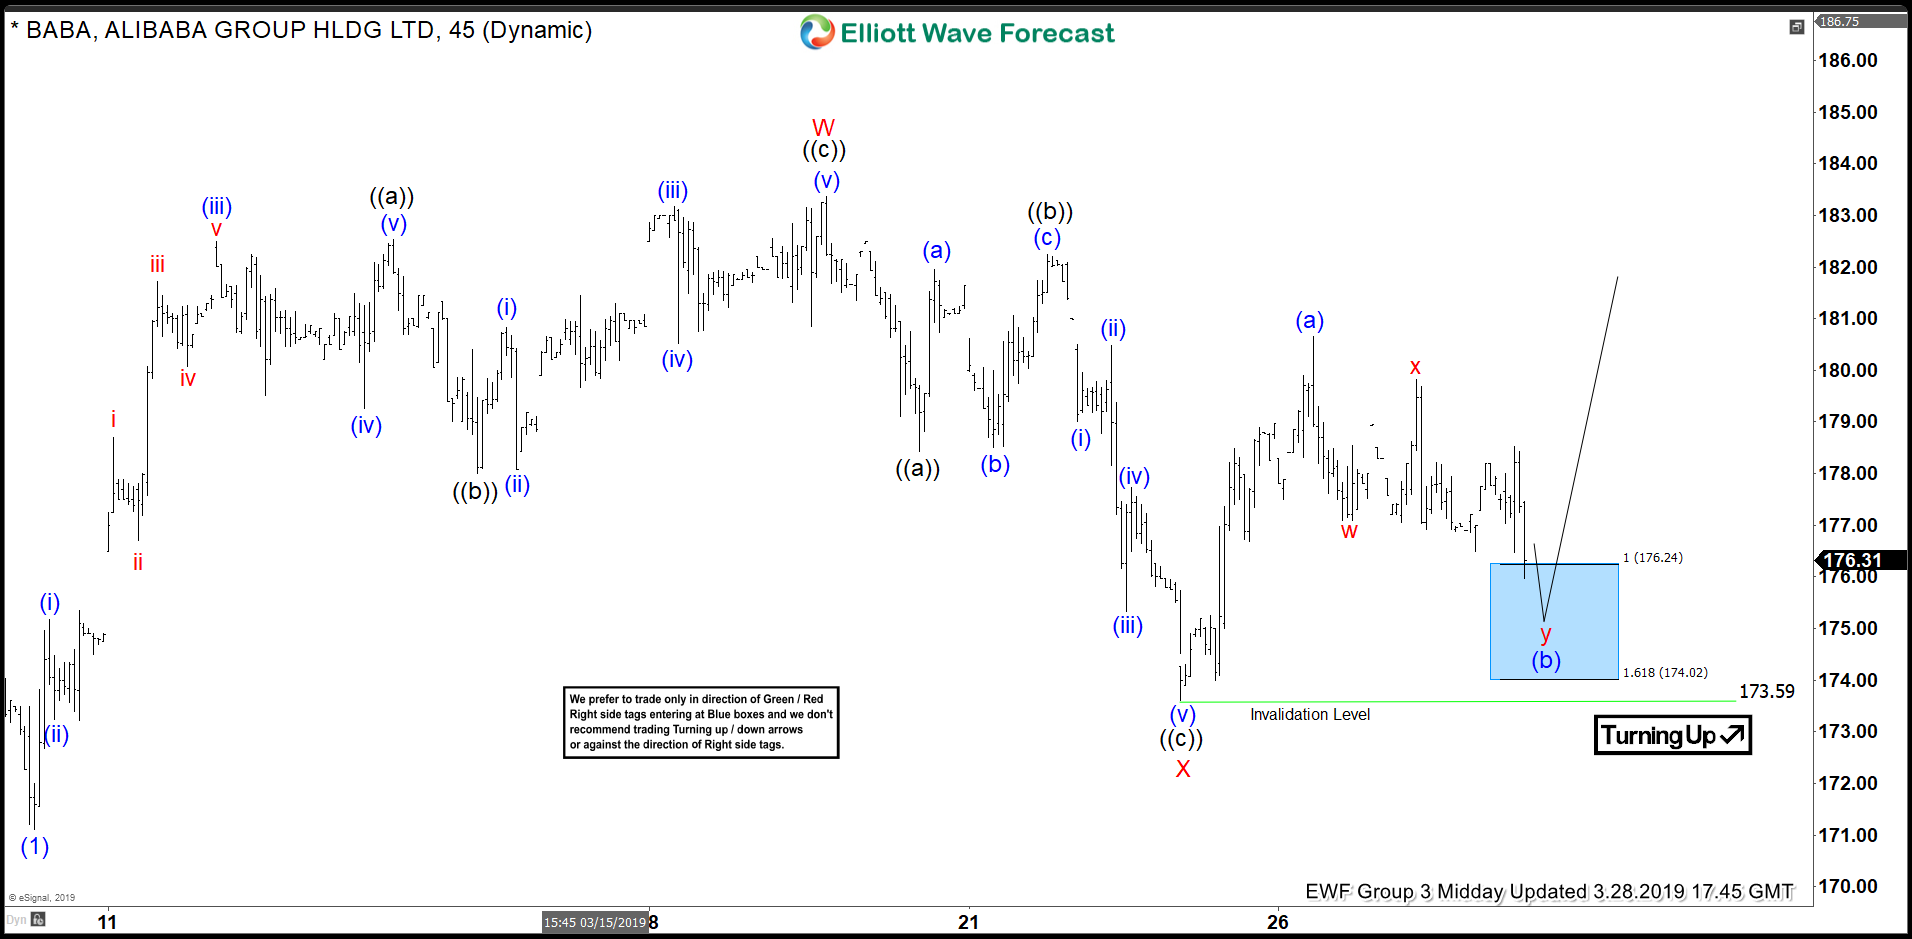
Hello fellow traders. Today, I want to share some Elliott Wave charts of the BABA stock which we presented to our members in the past. Below, you see the 1-hour updated chart presented to our clients on the 03/28/19. showing that BABA ended the cycle from 03/07/19 low (171.55) at the peak of 03/19/19 (183.48) in red wave W.
Below from there, we advised members that the pullback in red wave X ended at 173.59 low. Above from there it did the first leg higher in 5 waves of blue wave (a) which ended at 180.57 peak. Then below from that level, we said to our clients it should see the equal legs from 03/26 peak towards the areas of the 100 - 1.618 Fibonacci extension of the red wave w-x which came around 176.24-174.02. Therefore, we expected buyers to appear in the sequences of 3, 7 or 11 swings. And that was the first area for buyers to appear to take prices to new high above 03/19/19 (183.48) peak. Or a larger 3 waves bounce at least. As BABA entered the blue box it reacted quite aggressively to the upside.
BABA 03.28.2019 1 Hour Chart Elliott Wave Analysis
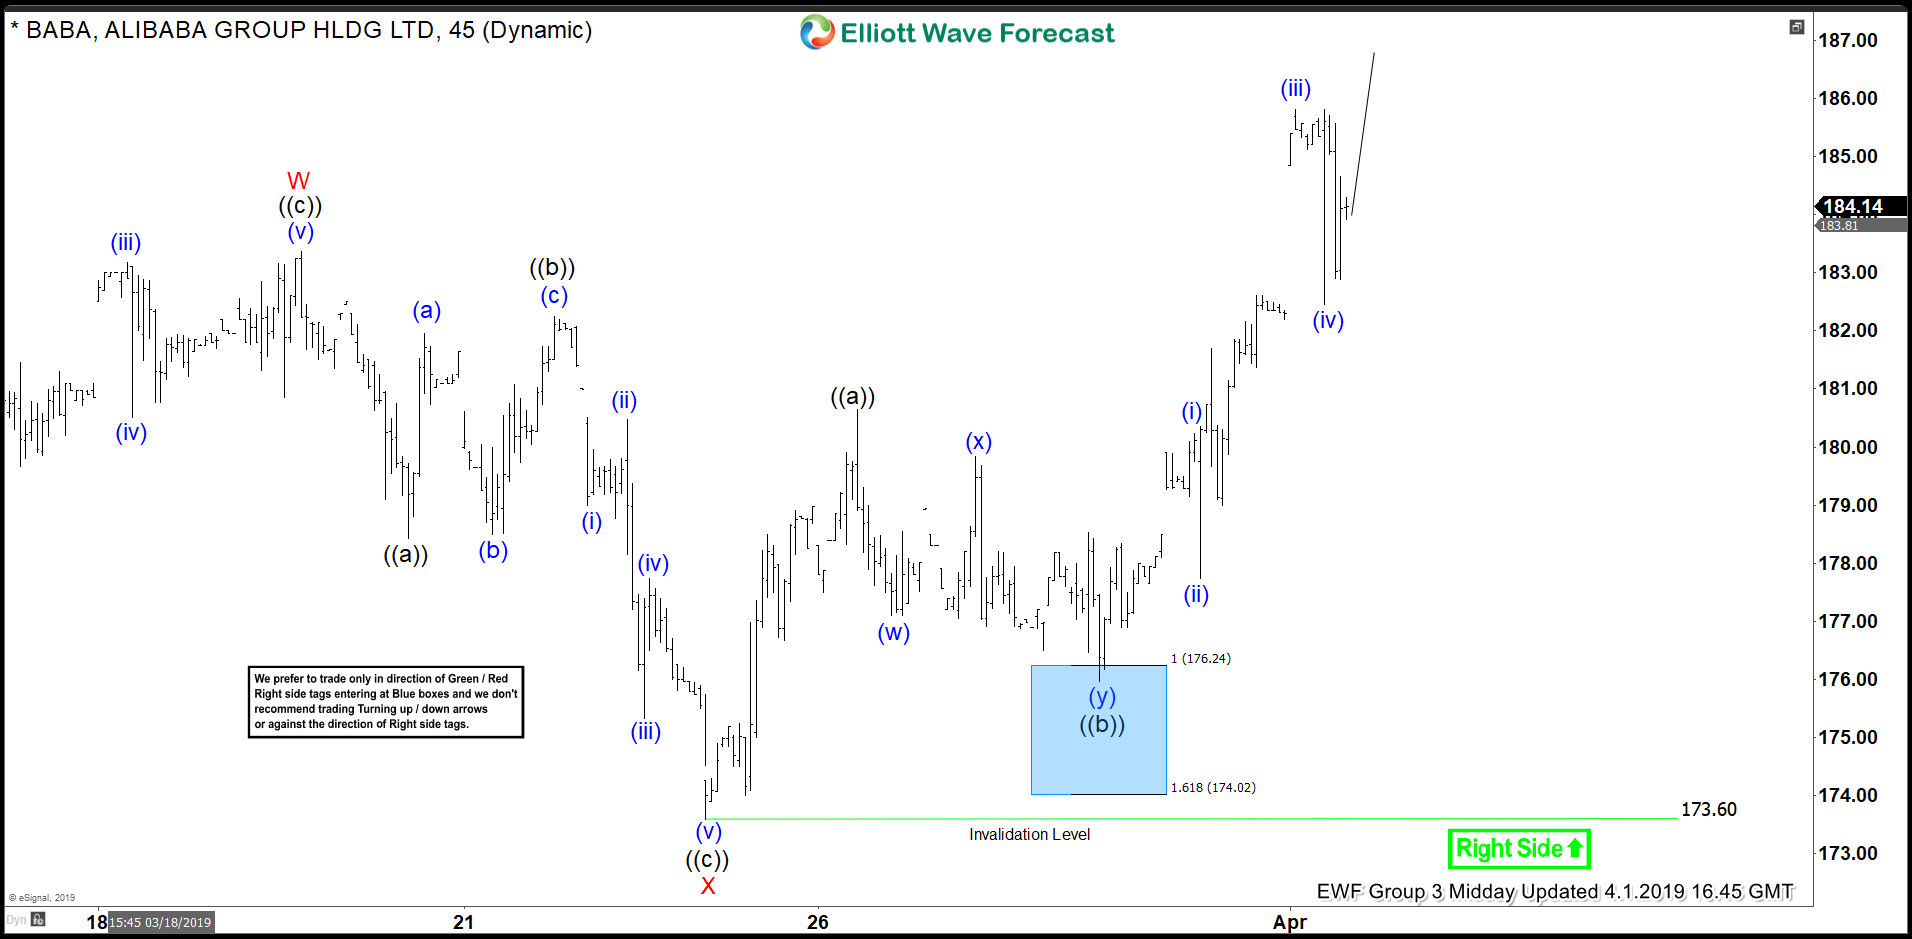
In the last Elliott Wave chart, you can see that BABA continued the strong reaction higher and rallied like expected to new highs. Above red wave W peak. Due to the turning up tag, we expected BABA to be supported overall in the 1H timeframe. If traded our blue box. Any trades from that area have been risk-free, which means the stop-loss was moved to breakeven, targeting higher levels. Do please keep in mind that the 1-hour chart which I presented might have changed already. The blue boxes you see in our charts are our so-called High-Frequency boxes. Where the market ideally shows us a reaction either lower or higher. These areas are used be traded in the direction of the right side.
BABA 04.01.2019 1 Hour Chart Elliott Wave Analysis
I hope you liked this blog and I wish you all good trades.