Hi all.
What a week for Bitcoin right? Like I’m repeating you last weeks it was imminent to see such movement.
Before the actual price action, I want to summarize the week into a couple of words.
First, we broke the 3 years symmetrical triangle at last and we did it with a significant volume. Till this night drop I was a bit concerned cuz we literally skyrocketed and like I’ve told you in the past, such movement without a correction is not healthy. At second point lets get to this night drop. Yes, it was significant but for me its actually a perfectly bullish. Why? You`ll see from the price action below.
Actual PA situation:
Support and resistance:
1.1. Support:
1st support - $10500 – last MAJOR resistance. This support has been tested already with this night drop and done its job perfectly. Thats why I’m bullish about this drop.
2nd support - $9000
1.2. Resistance:
1st resistance - $12500 – almost the last bigger resistance before the clear skies, accordingly to VPVR.
2nd resistance - $14000 – the last resistance before the 20K test I can say (the last top + VPVR).
Somewhere between 1st and 2nd resistance is $10K, which can act as a support too cuz of the psychological level.
10 EMA – the price is still above it even without a touch of it.
21 EMA - the price is still above it even without a touch of it.
Correlation between 10 and 21 EMA – Despite the Corona drop every time when the 10 EMA is above the 21 EMA and the price is above both we can predict a very good bull period.
Parabolic SAR – Another bullish week and there`s 14 weeks bullish signaling.
Weekly pivot point is $9757.62. We`re far from it so far, so I can say that next week can be positive too.
BTC volatility is still under 40 actually so more movements can be expected.
Thats all for now. Not much may be, but I think its explaining the actual situation. Next week i`ll try to go deeper.
See ya next time.
great analysis bro. i think btc will go even higher this year than records so far. keep up the good analysis, i always come here to find it so thank you!
Hi all.
Well, nothing major happened this week for me and despite the very good green candle, which is forming, theres nothing more to say about the PA. Other than that, theres something very good and major happened with Bitcoin but you`ll see it from the second chart.
Actual PA situation (chart 1):
Support and resistance:
1.1. Support:
1st support - $10500 – last MAJOR resistance. This support has been tested already with this night drop and done its job perfectly. Thats why I’m bullish about this drop.
2nd support - $9000
1.2. Resistance:
1st resistance - $12500 – almost the last bigger resistance before the clear skies, accordingly to VPVR.
2nd resistance - $14000 – the last resistance before the 20K test I can say (the last top + VPVR).
Somewhere between 1st and 2nd resistance is $10K, which can act as a support too cuz of the psychological level.
10 EMA – the price is still above it even without a touch of it.
21 EMA - the price is still above it even without a touch of it.
Correlation between 10 and 21 EMA – Despite the Corona drop every time when the 10 EMA is above the 21 EMA and the price is above both we can predict a very good bull period.
Parabolic SAR – Another bullish week and there`s 15 weeks bullish signaling.
Weekly pivot point is $11035.14. We`re far from it so far, so I can say that next week can be positive too.
BTC volatility is still under 40 actually so more movements can be expected. We`ve saw only a small part till now.
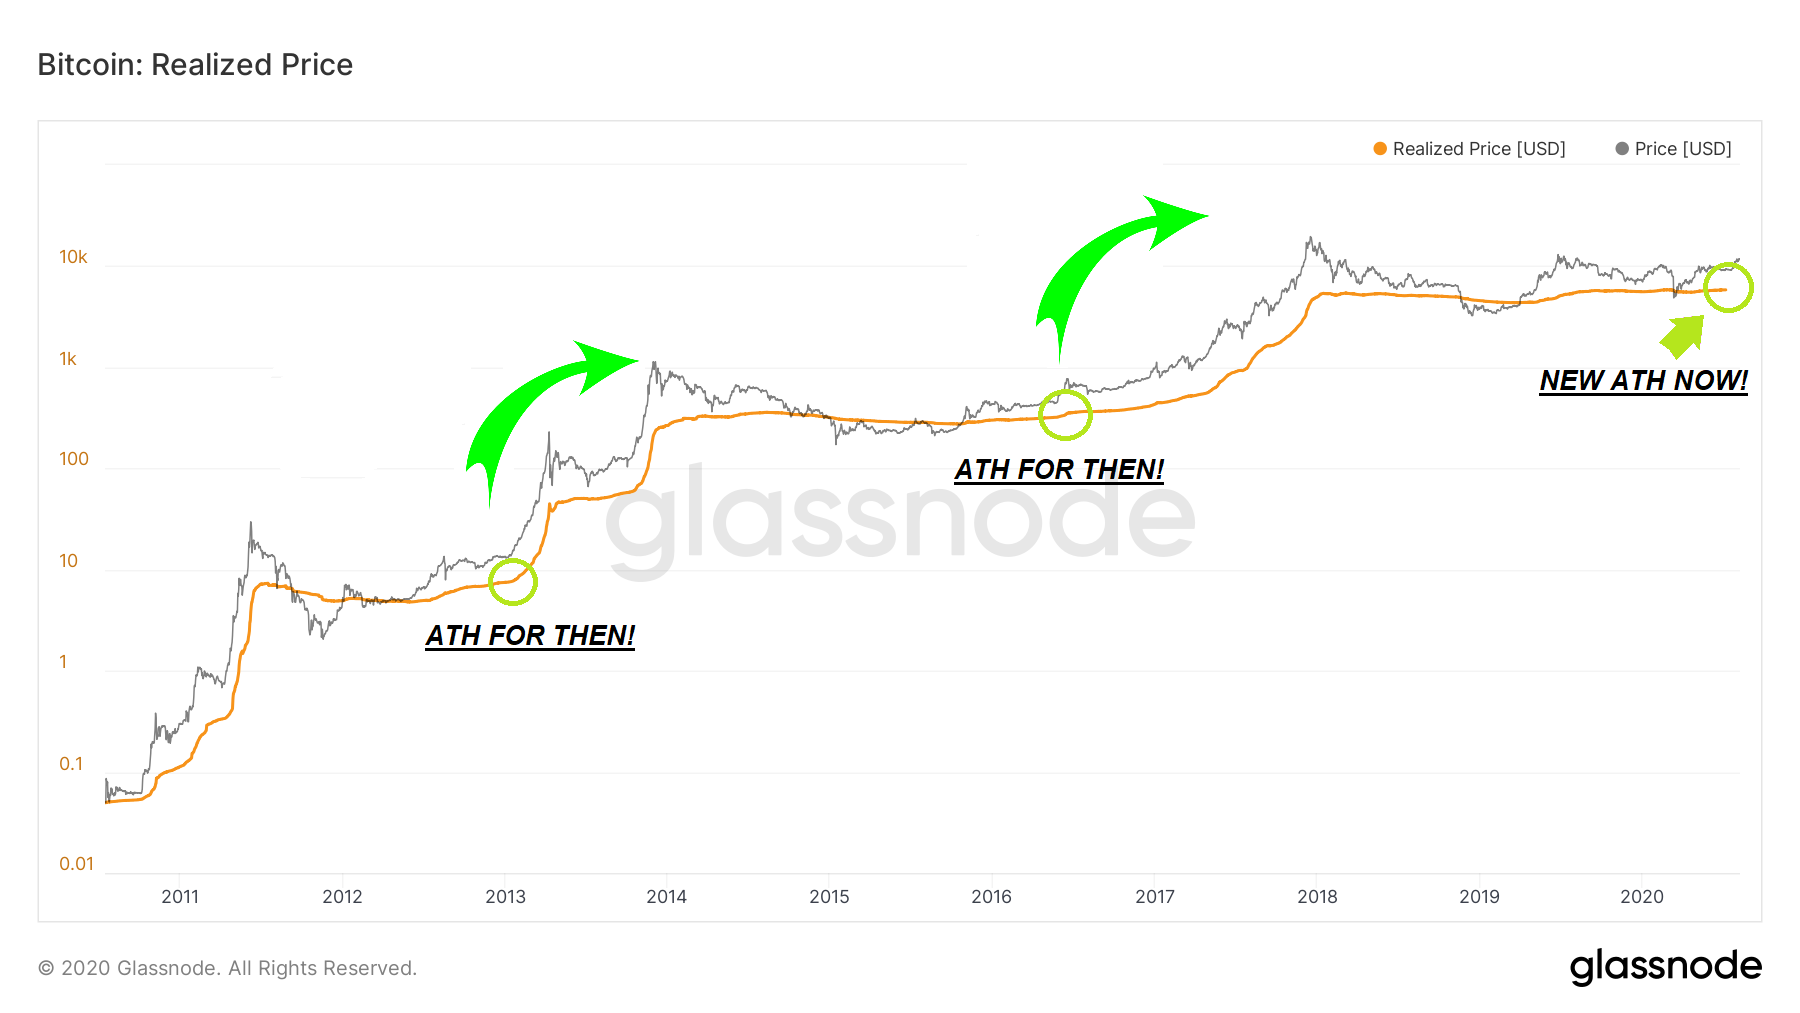
Bitcoin Realized price (chart2):
Thanks to Glassnode again we can check the Bitcoin Realized price chart. Its very simple and clear. The grey line is the BTC price. The orange line is Realized price. Realized Price is the Realized Cap divided by the current supply. Or simply said thats the price of all BTC paid in circulation right now. This Realized price at the moment is around $6000 and even above, which is the new all time high (ATH). If we check back in the past, every time when we saw such ATH we`ve had a parabolic run and a new price ATH afterward. BUUULISH!!!
Hi all.
Im very tired after this week so ill be very short but specific this time.
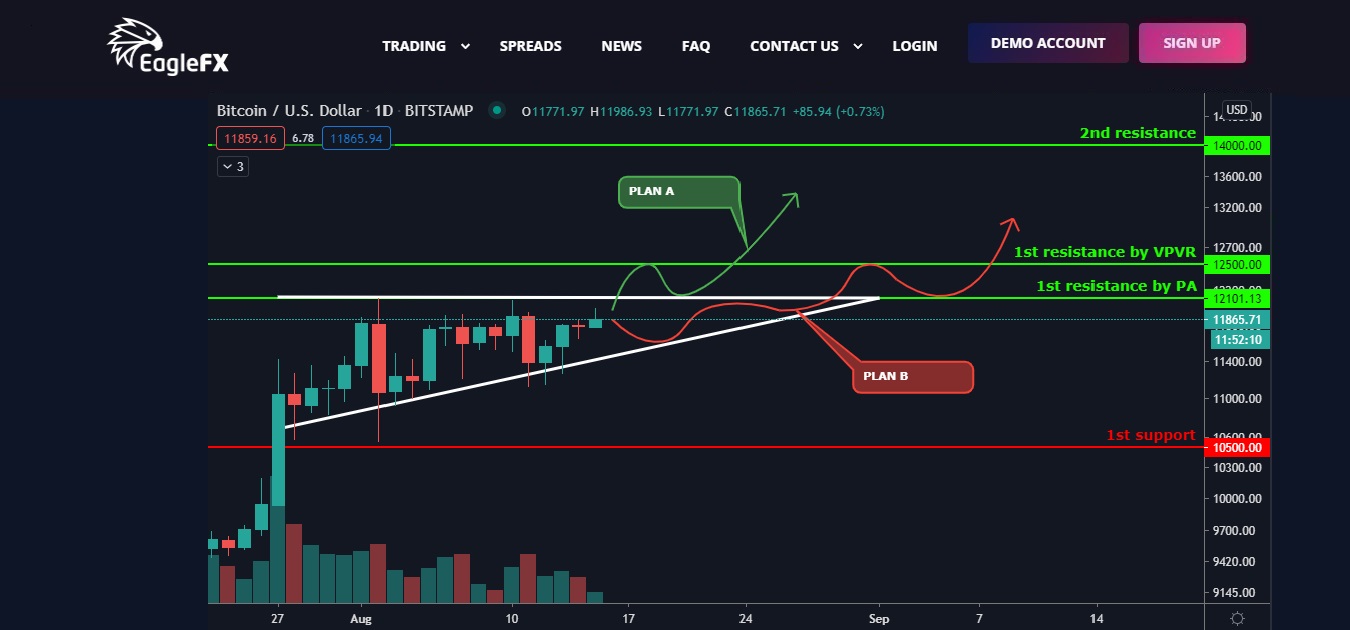
Im switching to 1D chart this week and theres an awesome ascending triangle. Its almost the same in the 4H chart. The breaking of this triangle is imminent. No matter which plan will be fulfilled (A or B) theres almost clear skies above the $12100-12500 level. I personally think that plan B will be fulfilled and this will happen at the end of this month or at the beginning of September lately (almost at the edge of this ascending triangle). The other needed rule to be this move not speculative is to see a significant volume when this happen. Even if theres a breaking below this triangle (possible plan C), were fine till $10500 and the bull run can continue after this dip to $10500.
More of the actual PA below.
Actual PA situation:
Support and resistance:
1.1. Support:
1st support - $10500 – last MAJOR resistance. This support has been tested already with this night drop and done its job perfectly. Thats why I’m bullish about this drop.
2nd support - $9000
1.2. Resistance:
1st resistance - $12100-12500 – almost the last bigger resistance before the clear skies, accordingly to VPVR.
2nd resistance - $14000 – the last resistance before the 20K test I can say (the last top + VPVR).
Somewhere between 1st and 2nd resistance is $10K, which can act as a support too cuz of the psychological level.
10 EMA – the price is still above it even without a touch of it.
21 EMA - the price is still above it even without a touch of it.
Correlation between 10 and 21 EMA – Despite the Corona drop every time when the 10 EMA is above the 21 EMA and the price is above both we can predict a very good bull period.
Parabolic SAR – Another bullish week and there`s 16 weeks bullish signaling.
Hi all.
Well, Bitcoin dropped 3% from the last week and around 7% from its high at the beginning of this one. Is it so bad? I dont think so! Why? Ill show you below so dont freak out but zoom out.
Last week daily chart VS this week possible re-charting (chart1)
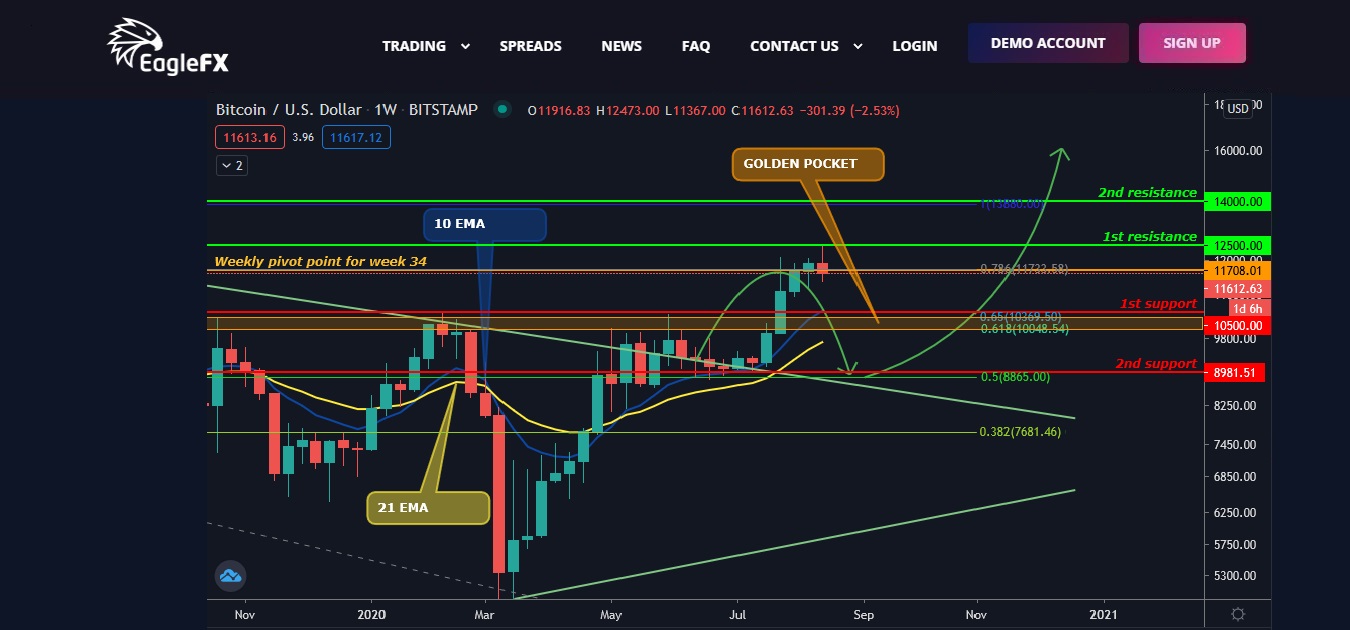
Last week I was talking about an ascending triangle and 2 (or even 3) possible scenarios. At the beginning of this week all seems like scenario A is in play until the decline that came from nowhere. My personal opinion is that both the peak to $12500 and the drop to $11400 are just a fake moves if were looking at this ascending triangle chart. Thats why ive tried to ignore it and search for another pattern and almost immediately I saw the ascending channel (trend). A perfect one. Which pattern from this 2 youll use is your decision but at this moment i`m 70:30 to the ascending channel (trend).
Weekly chart (chart 2)
Here are 2 things to say. The 1st one is that this chart was initially made at 28.06.2020. Look at the green arrows which are pointing the possible price move. Even I was surprised how accurate are they till now. The most important thing here is the newly added fibo retracement from the last summer 14K top to the corona drop to 3.8K this year. What can we see? A beautiful fibo golden pocket between 10K and 10.5K. This 10.5K sounds familiar right? So whats the conclusion here? Thats even if we fall far below this ascending triangle or if we fall below this ascending channel, then we have a REALLY STRONG support at 10.5K and even a bit below this (around 10K).
Actual PA situation:
Support and resistance:
1.1. Support:
1st support - $10500 – last MAJOR resistance.
2nd support - $9000
1.2. Resistance:
1st resistance - $12100-12500 – almost the last bigger resistance before the clear skies, accordingly to VPVR. You saw where we stopped this week – exactly at $12500.
2nd resistance - $14000 – the last resistance before the 20K test I can say (the last top + VPVR).
Somewhere between 1st and 2nd resistance is $10K, which can act as a support too cuz of the psychological level.
10 EMA – the price is still above it even without a touch of it.
21 EMA - the price is still above it even without a touch of it.
Correlation between 10 and 21 EMA – Despite the Corona drop every time when the 10 EMA is above the 21 EMA and the price is above both we can predict a very good bull period.
Parabolic SAR – Another bullish week and theres 17 weeks bullish signaling (despite this weeks red candle for now).
Weekly pivot point is $11708,01.
Thats all for now and like ive said it before – these corrections are healthier than you think.
See ya next time.