Bollinger band trading with MAs

[QUOTE=R Carter;179614]I would agree with you Johnny that the daily is king but not that a few hundred pips can go by the wayside just using the daily TF chart.

Hello Robert,

What you say is true for the more informed traders but for the uninformed it’s worse than your think. If the Daily hits a line of support on Monday and you’re waiting for some indicator to change color from red to green which only happens at the close of Tuesday’s candle then 200 pips in the trash is an understatement. The average high to low of the GBPUSD is around 180 pips which ain’t hay as they say.

You may be sitting there scratching your head on this but if you do that everytime you see this you will go bald and then we will look like the Bobsy Twins.:eek: The fact remains if ya don’t know then ya just don’t know. That’s why we try to teach the newbies a thing or two before they lose all their money.

I just looked at a thread last night on FF that was showing a trade setup with a single indicator and the charts had absolutely nothing else but the candlesticks. The newbies were posting their charts and they were proud as Peac*cks at the few pips they managed to wrestle from the market. The theme of the thread was “KISS” "Keep it Simple Stupid ". Now the simple truth is that this is a fool’s game as the signal tells you to buy long three to four bars too late and told you to sell three to four bars too late which eats up all the profit. The only profitable trades are the long continuous trends. Some of the charts being posted were the Daily chart which three full bars translates into a lot of Jack to lose man.

I have’nt posted on this thread yet as a friend of mine is posting there and I know he will take a more gentle approach to informing this group of their profit wasting ways then I would and introduce to them to the way of the S & Rs. He has likened me to a bear in a china shop on many an occasion and over time has softened my approach believe it or not although I don’t intentionally try to piss people off my explanations sometimes come out a little on the harsh side.

I’m just trying to wake them up and get their attention as people tend to read and not listen to your advice as they are just reading half asleep. They will then trade the same old way with the same old results and wonder why their forex accounts are getting lower and lower. I’ve had many traders send me private emails thanking me for the baseball bat over the head as they were not really paying attention.

After raising three children you learn the necessity of a good whack as my British Mother-In -Law likes to call it.LOL. Unfortunately for me she considered me something less than human coming from the backwoods of America and I needed her undivided attention to mold me into the man her daughter so rightfully deserved to have as her mate. The education started one day after meeting her with a whack on the back when I slouched and contantly correcting my grammar and my hillbilly accent.

All the males in this family were Oxford University graduates and the females were all privately schooled. Now you may have guessed by now that it didn’t take me long to ask myself what the Sam Hill did I get myself into this time after arriving at my In-Laws in the MidLands of England. The fact was I was in need of a good whack and thank her for the many whacks she gave me. I probably never “measured up” in her mind but we did find some common ground after a few decades.

So if I tend to whack the newbies a little hard it’s all my Mother-In-Laws teachings at fault.:wink:

Happy trading,

Johnny

Hello Robert,

Well I never said you could not make a few pips just that it wasn’t as accurate. I didn’t make that particular trade but I got your point. I looked at the trade and then looked at my charts to see where my buys and sells would be and they would be as follows:

Buy = 1.36499
Sell = 1.36764

Sell Short = 1.36764
Buy to Cover = 1.36646

Buy = 1.36646
Sell = 1.36903

52.2 gross pips maximum without costs deducted.

Method of entry = cross of bols SRs with Stochastic high at 100, Stochastic Low > 95 or Stochastic Close > 95. Trailing stop.

Method of exit = cross of bols SRs with Stochastic Low at 0, Stochastic High < 15 or Stochastic Close < 15. Trailing stop.

Crosstrend trade exit - Stochastics K > D.

I look at the SR’s as the final take profit and not the beginning point of my decision making. The small trailing stop is to let the price run. The down side is sometimes I get in or out early but the drawdowns are manageable. This is only part of my trading weapons as different situations require different tools.

I have a trade within the channel system as well which I’m revising to project the probable limits. This looks promising but who knows as it’s just something I’m toying with. I’ll post it when I get some time to get your take on it.

Happy Pips,

Johnny

Robert,

Wander over to TalonD’s Daily Hi-Lo thread and take a look see at the channel I’m trying to develop. Please give me your opinion. Don’t worry I’m thick skinned you won’t hurt my feelings. I’ve got an additional channel idea but wanted to post this first.

Thanks, Johnny

Hello Robert,

I looked at your method again and what you are doing it seems is moving down to the H4 or H1 to get the spread on your moving averages and waiting for the price to cross top or bottom and then doing your confirmation and making the trade. If you moved to the five minute your spread on your MAs is really small so you stay on the H1 or H4.

I’m not doing anything that different but I’m looking at it from a different view. I probably posted this before but here it is again. I’m also looking at the H4 or H1 but I’m looking at it through the M5 timeframe. An analogy of this is I’m looking at the price through a high powered scope and you are looking at the same target with open sights. We both can hit the bulls-eye but I have a distinct advantage. I will hit the bulls-eye every time and you will only get close every time with an occasional bulls-eye.

Please understand that this is not an attack on you or your method of trading. I traded exactly the same way before using my present method and this is just an analysis of the two methods. The whole point of being here is to learn from one another and to help the less informed.

I have on all time frames the H1 Channels and can see the top and bottom lines of that channel so I see exactly what you’re seeing. The main difference is you’re doing your confirmation on the H1 or H4 which to me is waiting for the train five miles past the train station. You are getting on the same train going in the same direction but I’m getting on the train while you’re still doing your confirmation. I’m also getting off the train sooner then you for the same reason.

From your last post where you made 37 pips from start to finish I actually took a side trip which the H1 chart saw as a little bump in the road. That little side trip picked up 11.8 pips bringing the total to 52.2 pips. Without the side trip the total was 40.4 pips which is not much different than your total pip count. Due to trading on the M5 my exits will be quicker. This will be true using your exit method or mine. The reason I took the additional trade was the timeframe I was on showed the price through the Upperband of the channel and it was still quite a distance away from the H1 Upperband.

You can use your exact method of entry and exit on all time frames. The lower the timeframe you’re trading on the closer to the actual high or low your exits and entries will be and the greater the profits. If you had the target of the H1 on all time frames would it not make sense to make the actual trade on the lowest possible timeframe? The answer is quite obvious so I will take the liberty of answering it so any newbies reading this understand it.

Every timeframe begins with one tic and as these tics accumulate the M1 closes as one minute of time has passed. As time passes the M5 closes and so on and so on until 24 hours have gone past and the Daily closes as well as the last candle of the day on the M1, M5, M15, M30, H1 and the H4. If you’re watching the Daily or even the H1 some of these moves are hardly noticeable. The fact is that the price is moving up and down and hitting lines of support and up to resistance and back to support on the lower timeframes.

To see this action on one chart look at the attached M5 chart. I know this looks like a bunch of spaghetti but if you look closely you will see the price bounce from top to bottom. Because the price is going up and down between the yellow M15 lines more often than it is between the hourly the number of trades are greater. The price is just not hitting the hourly top and bottom lines that single a buy or sell.

The gross pip count was 306.9 for the M15 vs. 116.3 for the hourly. Notice both trades took the trade to the Daily Aqua line. The H1 trades are the ones I would have taken but I believe that most traders would have taken the magenta straight line shown which would have only grossed 37.7 pips. There was only a 7.8 pip drawdown on trading the H1 but the profit difference trading the M15 was substantial. If you traded just looking at the Hourly chart your maximum gross would be 45.5 pips. (See chart). Your vision of the Price action is limited and hence you miss the trades.

No matter what exit or entry method you use the fact is you will make more pips viewing the lower timeframe. Keeping an eye on the Daily, H1 & H4 is always important. These can be your best of friends or your worst enemy. I believe in keeping my friends close and my enemies closer that’s why I want them on all my charts. I don’t like surprises hitting me between the eyes.

Now before the naysayers post “This isn’t true because I’ve traded on the M5 and the M15 and I didn’t make any money” or “I didn’t like all the noise on the lower timeframes” I want you to think and look again. In this example I did not trade the M15 just to trade the M15. I traded the hourly with the help of the M15 and took what the market gave me. After the huge downtrend before this trade the market went in a narrow range and if you were trading just the hourly chart you wouldn’t even know this was happening. Quite simply you cannot trade what you cannot see.

I hope I’ve opened your eyes and all of you understand this method of using the timeframes.

Happy trading,

Johnny


I think you missed attaching the example charts.

Hi JohnnyBS, thanks once again for your highly informed reply. You may find this hard to belive but i’ve actually been a sucker for indicators. Been using them for quite a while now and you are right, they look good at first but in real trading they just stab you in the back. But can you tell me if you use any setting for your stochastic and CCI.

Thanks Again
ADE

Robert,

Thank you for your response. Thinking back at some of the trades I’ve got into in the past I’d have to say you are absolutely correct. Trading the lower time frames can be a recipe for a heart attack. You have to be quick on the trigger and you will get into bad trades which require you to reverse directions quickly. It’s not for the faint of heart. You do not have to take the small moves up and down to the Daily or H1 and is only your choice. As I get older I can fully appreciate your more relaxed and safe method of trading.

Because of trying to understand and learn how you trade and comparing your method with mine I’m developing a safer and less stressful way of trading. I am leaning more towards your method than mine and have found a way to get a lot of pips but in a much less stressful way of trading. Having been a perfectionist all my life and a lover of solving problems and creating things has lead me down many dead-end paths in this forex game but has been successful.

This natural tendency of making the simple thing more difficult is well documented by my right-brained family. There have been only three known left-brain dominant individuals in my family for generations which includes both sides back to my great-grand parents. I’m the only one still alive. I’m left-sided to the extreme which has made me somewhat of a black sheep. They don’t understand me and I can’t figure out what makes them tick. They don’t care how the car works they just want it to work when they turn the key in the ignition. I’m a just got to know type so hence my never ending search to learn different trading methods.

Your method and posts have led me down a very interesting road and I thank you for your insight and patience. I’m going to trade this new method and see where it takes me. Thanks again.

Happy trading,

Johnny

Too bad,i have been MIA lately.

Hello ADELEKE,

Here are my indicator settings.

[B][U]Stochastics[/U][/B]

In one panel I have a setting for stocastics of 24,3,3,1, Close which I use for watching the K & D values switching back and forth as the price turns up or down for entry and exits. But I also like to use three all in one panel. This is a dynamite indicator with the settings as follows:

  1. Red -Low, Low ,Low, 14,3,3,1
  2. White - High, Low, Close, 14,3,3,1
  3. Blue - High, High, High, 14,3,3,1

As the Price moves up and crosses key S&Rs such as the Bols-9 the Blue will hit 100. As the price continues up all three will hit 100 and then you watch the 24,3,3,1 for the D to rise above the K value Plus a number such as five or 10. This number varies depending on the timeframe. If you change the number 24 to something else then the factor you use to filter out the little headfakes will have to change as well.

The reverse is true when the price moves down and the value will hit Zero for all three. Now the K value will rise above the D value plus a filter factor. Always watch the clock as a major market open can either reverse or send the price up like a rocket. In large moves up or down all three will hug the 100 or the zero and only the K & D values will tell you of the reverse. In low volume such as between the opens it will go to 100 and back to zero on a regular basis. In high volume the 100 and zero values will appear in succession as in multiple down and up candlesticks. On candles with a long wick the close value will reach 100 and then may go down as the price retraces from the high. You will also see the values of K & D flip flop as well. On long candles that are way above a major resistance line I sell on the flip of K > D to K < D.

[B][U]CCI[/U][/B]

The CCI does not work well at the same setting on all timeframes so more than one is required. It is a very fast reacting indicator that sometimes overreacts but it lets you know quickly if something is about to change.

[B][U]CCI Rainbow[/U][/B]

  1. Aqua - 7,3
  2. Blue - 15,3
  3. White - 30,3, Red - AVG.
  4. Yellow - 45, 9
  5. Yellow - 60, 9
  6. Lawn Green - 75, 9

Another that works well is this group in one panel.

[B][U]THE SMART GANG[/U][/B]

  1. CCI - 10,9
  2. CCI - 38,9
  3. TRIX - 3. CLOSE
  4. DPO - 14, CLOSE
  5. DSS - 8, 3, CLOSE

I hope this helps,

Johnny

Hello Again ADELEKE,

The stochastic 24 setting depends on the timeframe you’re looking to trade. You may find a 14 setting better to start out with and adjust as the situation warrants. You should try this on a demo first and adjust the settings to your liking.

I may have misled you on the 100 and Zero values as they all don’t hit this value all of the time. The key is to watch the High blue line when the PA is moving towards resistance and watch the Low red line when the PA is moving to Support. All three will be going in the same direction but depending on the timeframe they may not all hit the 100 before reversing. Again try this on a demo or simulator.

I used this last night on the M1 and was netting $1000 per hour. I noticed afterwards everything I read was saying how bad trading was on the GBP/USD. I guess I was just clueless to this news. It will make you money when used with knowledge of how to trade the S&Rs. Look at the GBP/USD between 1:19 am EST and 2:17 am EST. One thousand was easy to make. You won’t see this on the high time frames. Just look at the M1, M5 & M15. The higher timeframes do not show the support to resistance and back to support movement of the PA because they are within the higher timeframes. Close your eyes to the so called noise and just trade from breaks through the S&Rs. The advantage of the M5 & M1 is even a mistake doesn’t cost an arm and a leg. If you are making too many mistakes reading the charts then something is missing in your education of trading the S&Rs. This is so easy a caveman could do it believe me. The first battle you’re going to have is with your own brain telling you this is impossible to make this kind of money. Get all the negative thoughts out of your skull and just do it. Don’t listen to the naysayers that tell you you’re crazy and it can’t be done. Your actions will follow your brain and if your brain keeps telling you it can’t be done then the results will be negative.

My son had this problem and was a nervous wreck when trading live. I told him to have a few beers and then try it. After six beers he was trading like a pro. This game is 95% psychological and once you conquer this there will be no stopping you.

[B]Insanity: doing the same thing over and over again and expecting different results.
Albert Einstein[/B]
If you continue with the same old thoughts and the same old tools to do the job then why would you expect any better results? I’ve run into this time and time again in the business world. A company I worked for was firing workers for lack of production and I believed the problem was not with the workers but with the method and with the lack of training. The idiots at the top finally relented after months of me hounding them and let me build a new work station. I asked for $30,000 to build it and they gave me $8,000. I asked for two men to build it and they gave me one. I asked for a draftsmen and they gave me none. I asked for two workers and they gave me their worst producers that they were ready to fire.

Undaunted I retrained those two workers, I bought used equipment and rebuilt it and worked nights and drew up the plans. The end result was the two men that they were ready to fire were now the most productive. Because the workers were on an incentive pay system and the new system was producing twice the product the owner started to complain about how much money these two men were earning.

I did not change the amount paid to the workers for each finished part as I had a verbal contract with them at the very beginning. I explained to them that they were on the firing list but if they would cooperate with me I would teach them. I explained my ideas and projected production levels. If they helped me I would let them reap the profits for three months before changing the amount paid for each item produced. Because nothing travels faster through a manufacturing plant then somebody making tons of money I knew selling this method to the rest of the workers would be an easy job. They were making double what the top producers were making before.

Through all of the time I took to build this the naysayers were all laughing and saying I was crazy and it could not be done. I ignored them and not one of these fools ever said a thing after I proved them wrong. The funny thing is the two workers I retrained are now in management for that same company. The two biggest naysayers were both fired. The owners never thanked me once. I left that company many years ago as I couldn’t take the idiot owners and the rest of the negative thinkers any longer. That company is now in bankruptcy and the reason is obvious.

[B]We have met the enemy and he is us.[/B]
[B]Walt Kelly[/B]

Negative thinkers will never win in any game they play so ignore them. The funny thing is we are surrounded by them, our family members, our friends and our co-workers. Successful people dance to a different drummer. Which drummer are you dancing to should be in your thoughts and if you cannot dance the dance then take dancing lessons.

Trade well and prosper,

Johnny

hi JohnnyBS,
I really appreciate the way you take your time to explain thing so explicitely. You display such ease and humour that you make forex trading look like child’s play. The day i can do that, i’ll consider myself a pro. The beer thing woundn’t work for me though(don’t drink).
I can’t trade the 1M,5M, or the 15M, for two reasons.1-I run a laundry outfit and am usually quite busy and the pattern which this lower time frames jump up and down, it could easily give anyone a heart attack. The least time frame i can trade is the 1H, now do you have any setting for Stochastic Oscillator on that time frame? Also the (24,3,3,1) 24 fixed maximum right?
Can you pls post the indicator CCI rainbow?
This is the part you say "Okay this Adeleke person is becoming a real bug"
SORRY;)

Thanks again
ADE

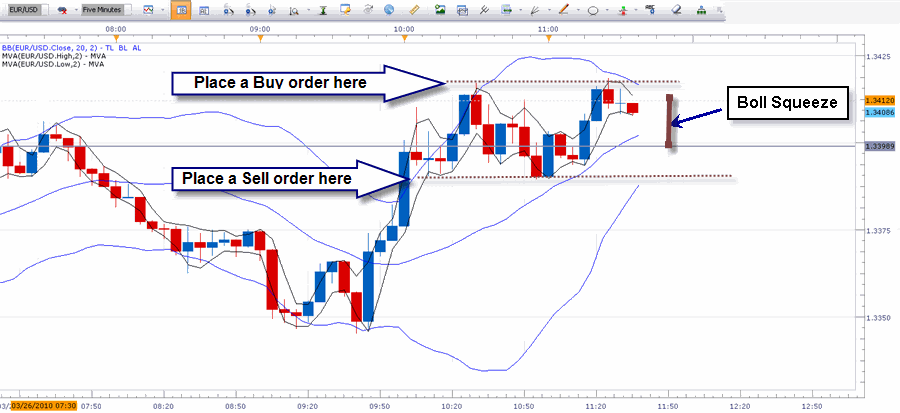
It isn’t MA-related, but has anyone here tried buying breakout price moves from bollinger band squeezes? I have no idea if this would work, I just noticed that after a squeeze price seems to want to move in a given direction for at least a short period of time.

You could but you’re essentially placing a buy order right at resistance and a sell order right at support before you know which way it’s going to break out - tricky to get right.
It’s the same even waiting for the breakout, price has to show you it’s breaking out first.
You could wait until price hits the upper bollinger band, upper band then starts to move upward and then you wait until price confirms it’s still in the BUY ZONE defined by staying between the 20:2 and 20:1 areas and then buy.

As an example (SELL in this case), put up a 20:1 and 20:2 on the euro Daily. End December 2009, price breaks downwards and then stays between 20:1 and 20:2, you could take short entries on any of the smaller timeframes when price fails to break above the 20:1 boll.

ADELEKE,

It takes two years to understand this game so I fully understand why you have so many questions. I do not trade the MT4 platform and do not have the CCI Rainbow set up on MT4. Just use the settings I posted earlier and place them in one panel by highlighting the CCI indicator and dragging to the panel.
The stochastic setting is 14 to 24. The setting depends on how quickly you want the K & D values to react so do your own test and vary the setting to your own liking. The reason for your not trading on the M1,M5 and the M15 doesn’t hold any water whatsoever. You really don’t have to trade the M5 when you’re on the M5. Try trading the H1 on the M5. Instead of you going to the cleaners you will take the market to the cleaners.:cool: I know this seems to be a mental block for the traders on this thread so if you don’t understand I won’t be surprised.

Happy trading,

Johnny

JBS I apologise if this is a dumb question but I don’t understand your settings, the stochastic indicator I use has 3 settings for example the commonly used 5,3,3 slow stochastic, what is your 14 setting and how do I set that ?

Also what is a CCI rainbow ? Is that based on the rainbow oscillator with CCI lines imposed on it ?
Or are your settings for several CCI lines in one indicator , if so how do I set the CCI ? you have two settings for each CCI, my CCI only has one adjustable setting which is for the periods to be used, what are your two settings for ?

Hello SDC,

Please don’t apologise for asking a question. Every question has an answer and it is only dumb of you not to request an answer.:eek:

Some Stochastic indicators have a further smoothing value of which I set to a value of 1. If your dose not then disregard the forth number and set it at 14, 3,3.

The CCI rainbow is just my invention of multiple CCI values in one panel. Again like the Stochastics indicator there are some different CCI indicators some of which I created myself. This is a forward weighted version that reacts very quickly. Just use the first number for the setting.

To set this up in one panel first click on the CCI and create a panel set to the first number and color. Then move your curser to the Navigator and over the CCI. Push the left button down and hold while dragging to the CCI panel and then release the button. Now you will see a second CCI indicator along with the first one you created. Set the period setting and the color of the second CCI. Do the same procedure again until all the CCI values are in the same panel. You can go back and change the colors to your own preference.

Happy trading,

Johnny

Wow… I can’t believe I finally finished reading the 380 pages…It’s been what? a couple of weeks, maybe more…I’m not sure. Anyway, too tired to make any coherent reply, but I do have a couple of questions…
This thread contains invaluable gems all through it, but they’re hidden in almost 400 pages. SanMiguel made a very good work of summarizing the (at that moment) current methods on the first pages, but the last edit was made back in November. Since then a lot of modifications have been made. I recall reading at some point a post suggesting the creation of pdf files. I think this is a great idea, and I’m willing to spend some time on the creation of these files, but first we need to identify all, or at least the most important systems that have been mentioned, and then ask the poster (Mr Carter, San Miguel, TalonD, etc) for the current rules.
Out of what I can recall I gotta check back, there may be more I remember

1- Talon D’s LWMA 1hr crossover
2- R. Carter daily 2&4LWMA with hedging on retraces
3- Matt’s (R.Carter’s son) 15m/5m following the 1h/4h trend
4-San Miguel’s flat Bollingers

I’m currently through my “understand, back test, forward test and choose” strategies phase, still on demo but hoping to go live somewhere in the next few months, so I think devoting some time to prepare a document where entries, exits, TPs, SLs etc (a complete strategy) are defined would be very beneficial for my own learning process. If the document can be used by others, even better.

Do you think this is a good idea?

If you have any comment, please let me know.

ah, btw, obviously any document would have to be proof-read by the creator of the system. English is not my native language, and my trading experience is meager, so I wouldn’t want to post any unreviewed doc

Excellent idea

By all means go ahead, it will probably solidify your understanding but it’s not a “strategy” as such…more of a collection of things to look for. The trade sizes and stop losses are up to you but you will see above/below the most recent wick suggested in various places.
As you can see from the refinements of the front page, there is more than 1 way to skin a cat.

As far as my 1hour strat, Robert still likes it. I kind of got away from it due to having a hard time being there to catch the crossovers and also it looses profitabilty in ranging markets. and as Robert said it takes titanium balls to hang on to some of those trades. :smiley: