In My Opinion Pin Bar Is Strongest Candle Pattern for Reversal.
I agree. Pin bar is very strong. But i think tweezer is the best.
Sorry but that is wrong, pin bar is single candle, it is a strong signal but even some dark cloud cover or piercieng line patterns can override a pin bar.
But at the end is not about the candles patterns, is about the candle patterns around significant areas of S/R
Gravestone & Dragonfly Dojis. You see them around important S/R zones. Just pull the trigger! 
I suppose that gravestone on a resistance and dragonfly on support, isn’t it?
Exactly right.
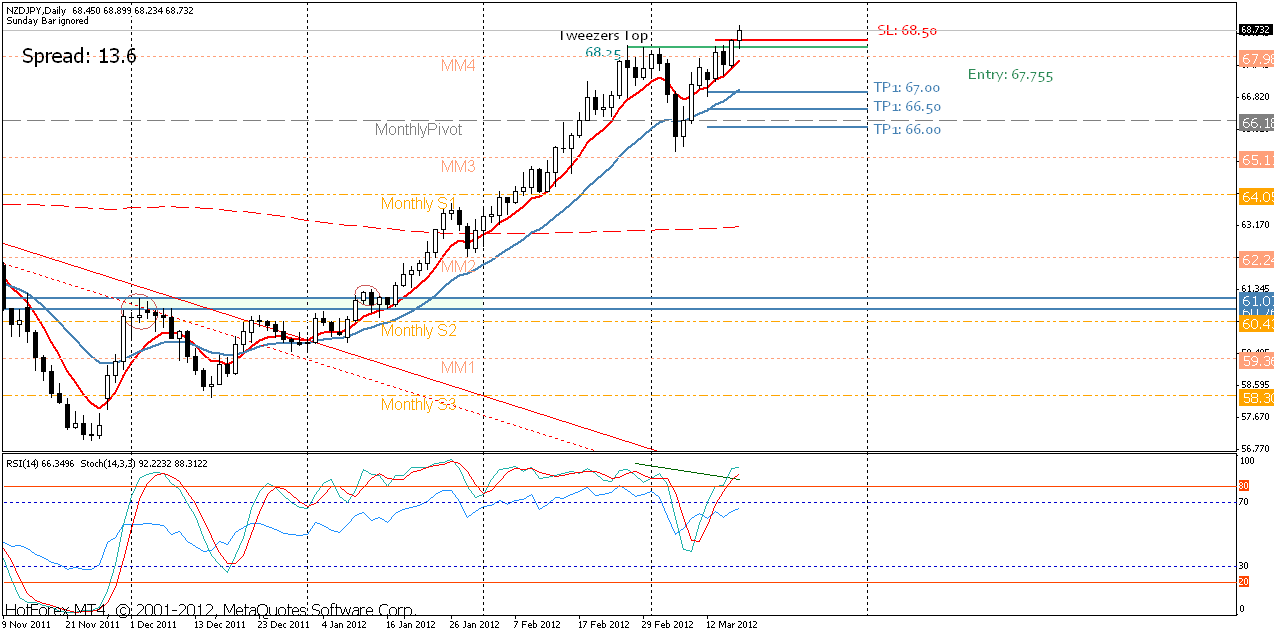
NZDJPY got me stopped out last week. Pretty much the price went through the rough ignoring the possibility of a reversal. Though, I’m not still convinced that the price will be heading any higher than the ultimate 70.00 multi year target. Let’s see how things develop.
Entry: 67.751
SL: 68.50 — (-74.9 Pips x 3 Lots = -224.7, -2%)
Besides the stop, fantastic weekend that was starting the new season of Formula 1 2012 Championship. 
This is pretty interesting one. Yen index is highly oversold, I suspect a reversal might be ahead. I’m looking to short his one as we find a slight variation of an Evening Star around a significant Resistance zone.
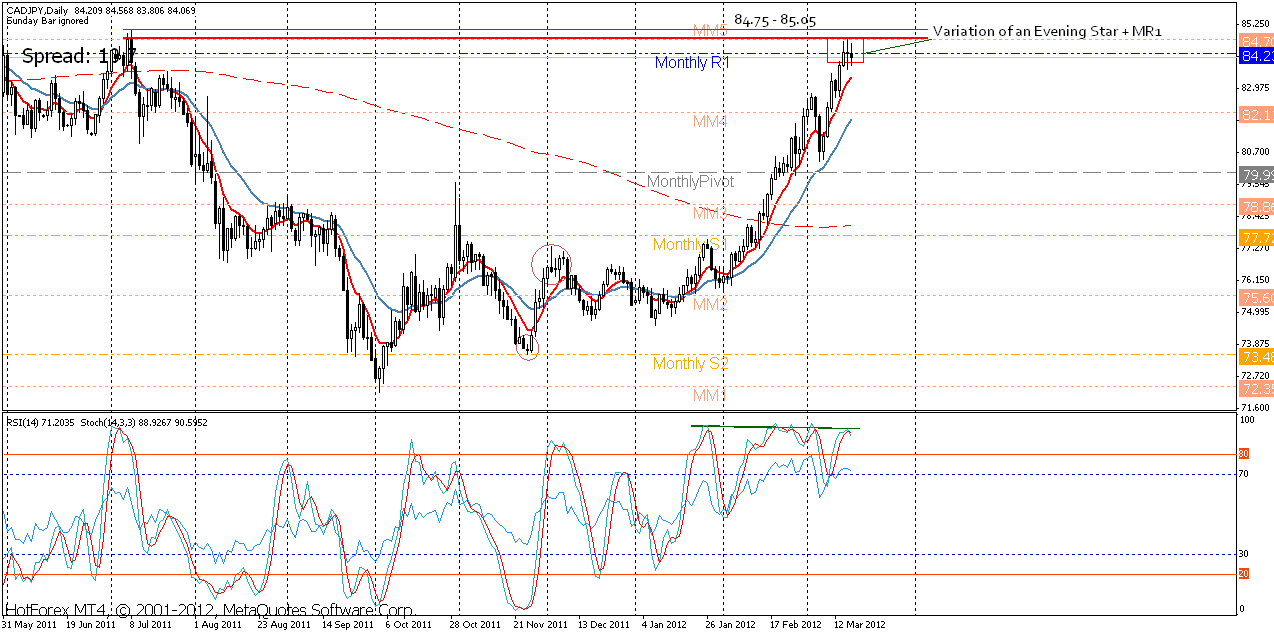
Have a nice trading week.
Which one do u give much weigh for ? is it monthly or weekly ? which one is more reliable ? apart from stop loss and profit taking, is monthly middle any useful ? I did not see anyone using monthly middle levels…So was asking you…
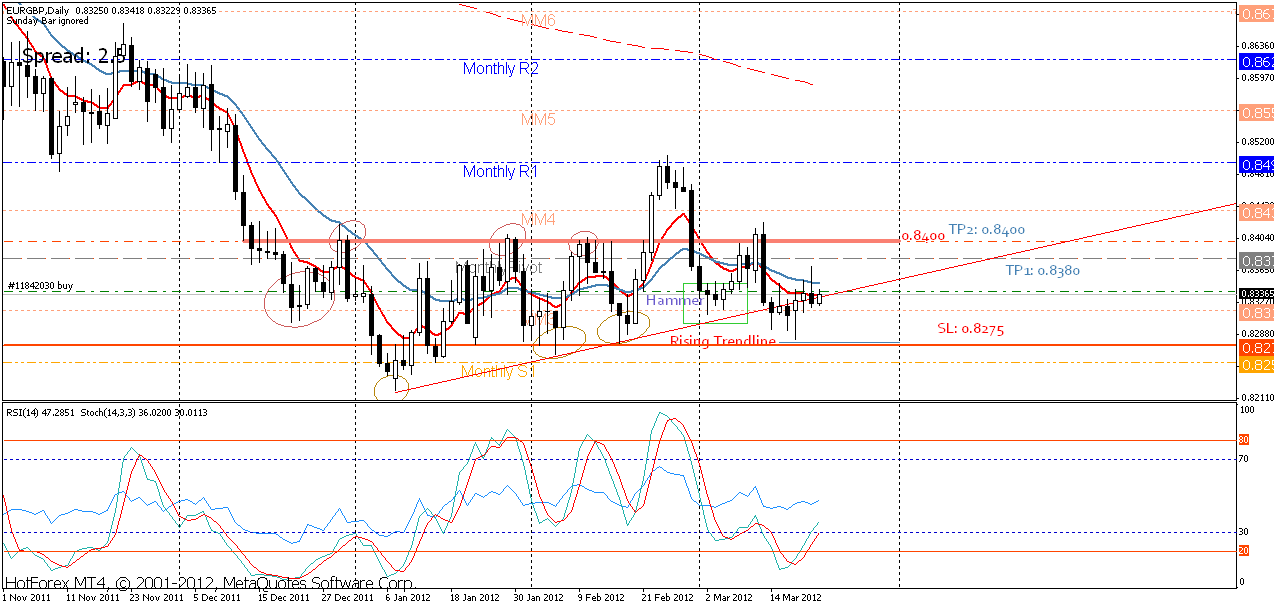
I’m sorry guys I just couldn’t upload some setups lately on time. So this is my latest trade I’ve took. In fact I took it two days earlier.
Entry: 0.83395 (Long)
SL: 0.8275
TP1: 0.8380
TP2: 0.8400
Chart:
Even though it’s a bit earlier, it’s a valid deal based on that Hammer (4th to last candle).
Have fun.
Disclaimer: TRADE ON YOUR OWN RISK. THIS RECOMMENDATION IS MEANT FOR LEARNING PURPOSES ONLY.
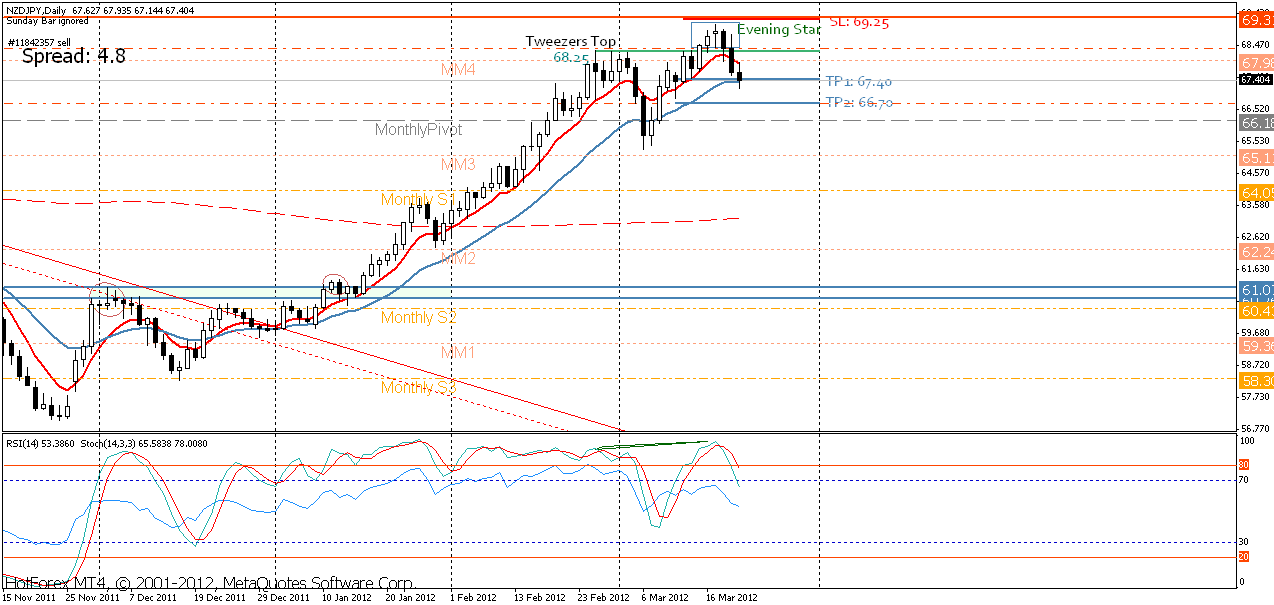
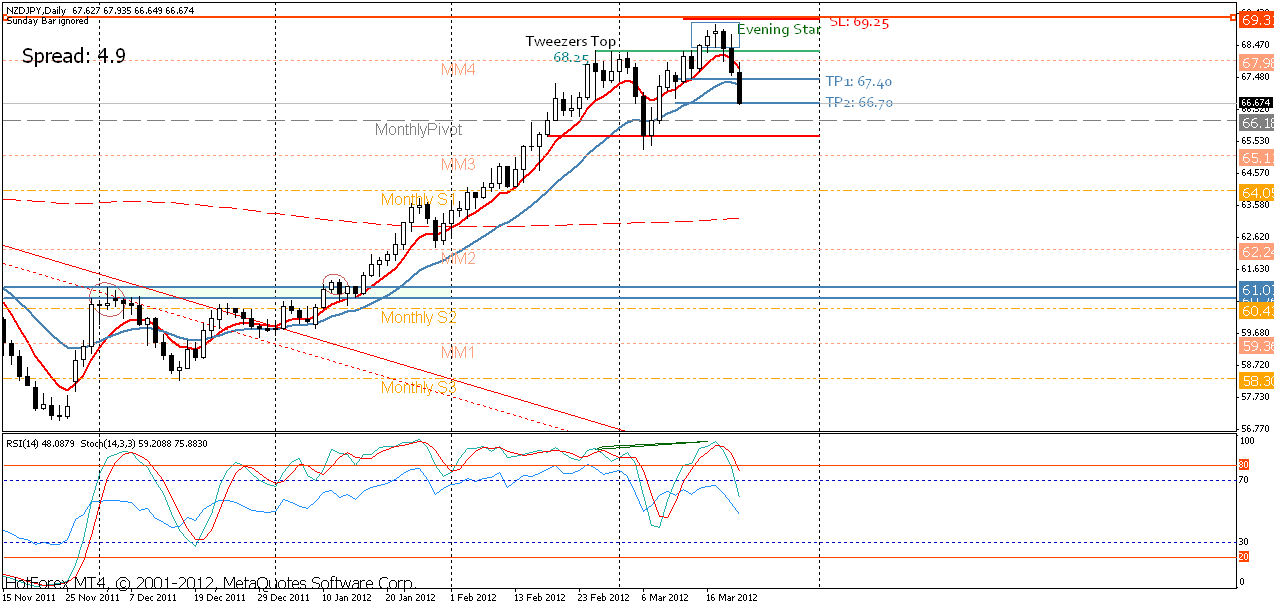
This is another trade I’ve taken. A short trade based on the Evening Star formation, I’m already in the money on this one, as the 1st target has been reached already.
Entry: 68.376
SL: 68.376 (Break Even)
TP1: 67.40 (+ 97.6 Pips)
TP2: 66.70
Chart:
Evening Star is very powerful.
Have fun.
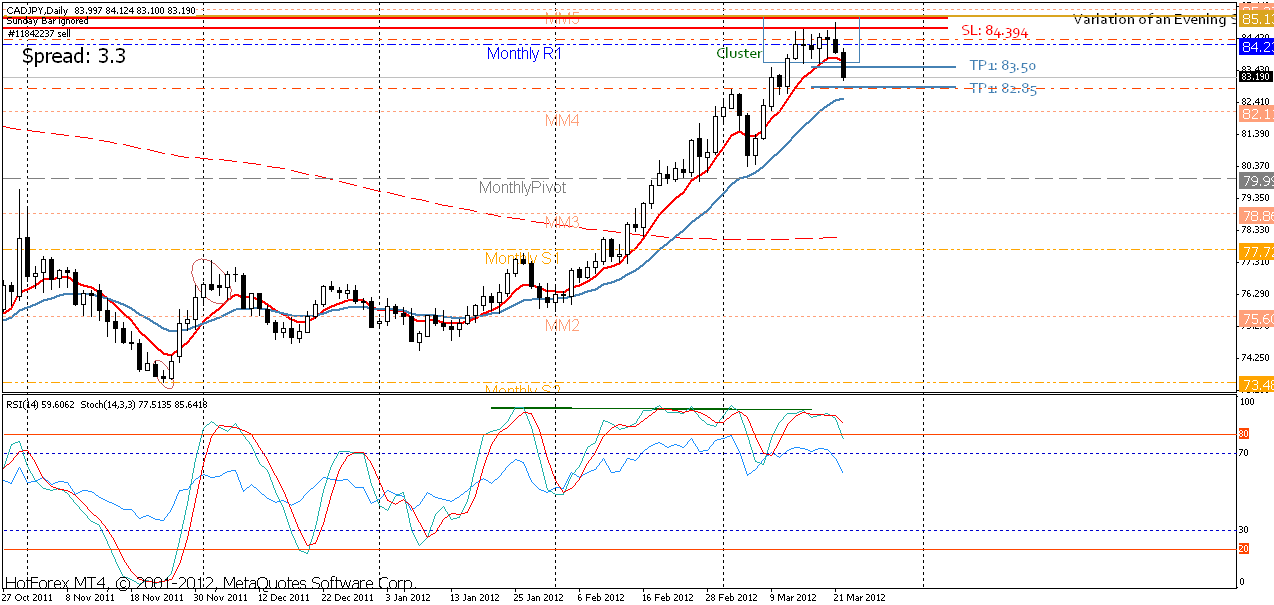
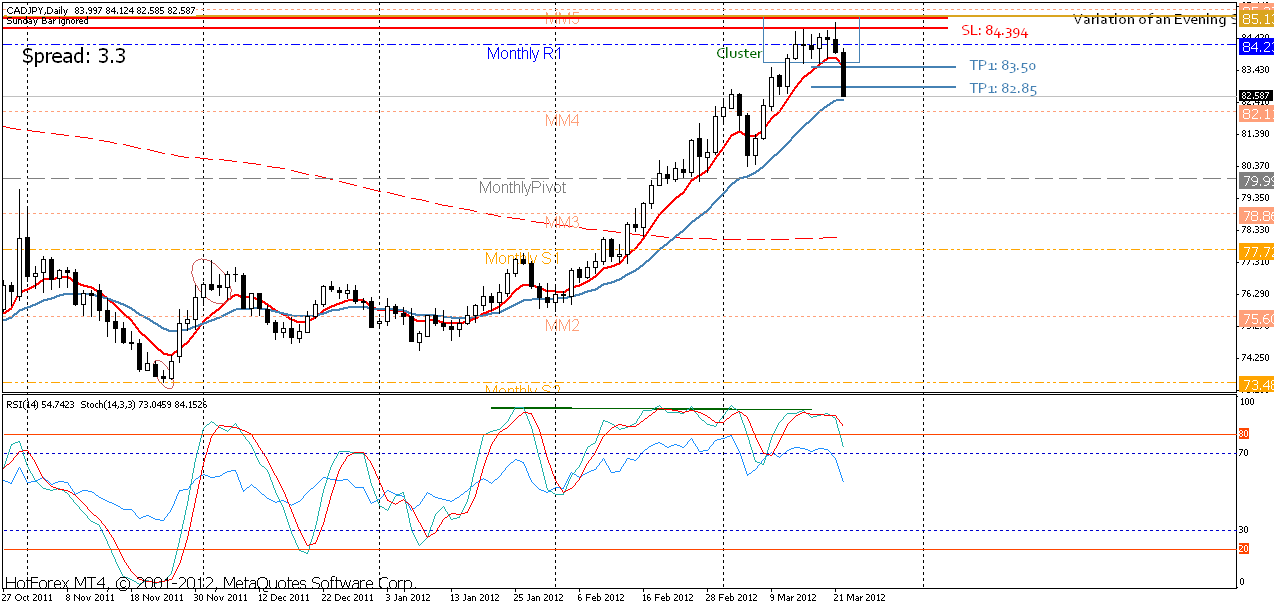
This is another trade that I’ve taken based on the Cluster of multiple Candlestick formations (Long Ledged Doji, Spinning Top, Hanging Man, Shooting Star) -This is another powerful formation, as the market is showing massive signs of exhaustion. In terms of reversal, we might not see any major reversal, but at least for a partial retracement this could be a valid deal.
Chart:
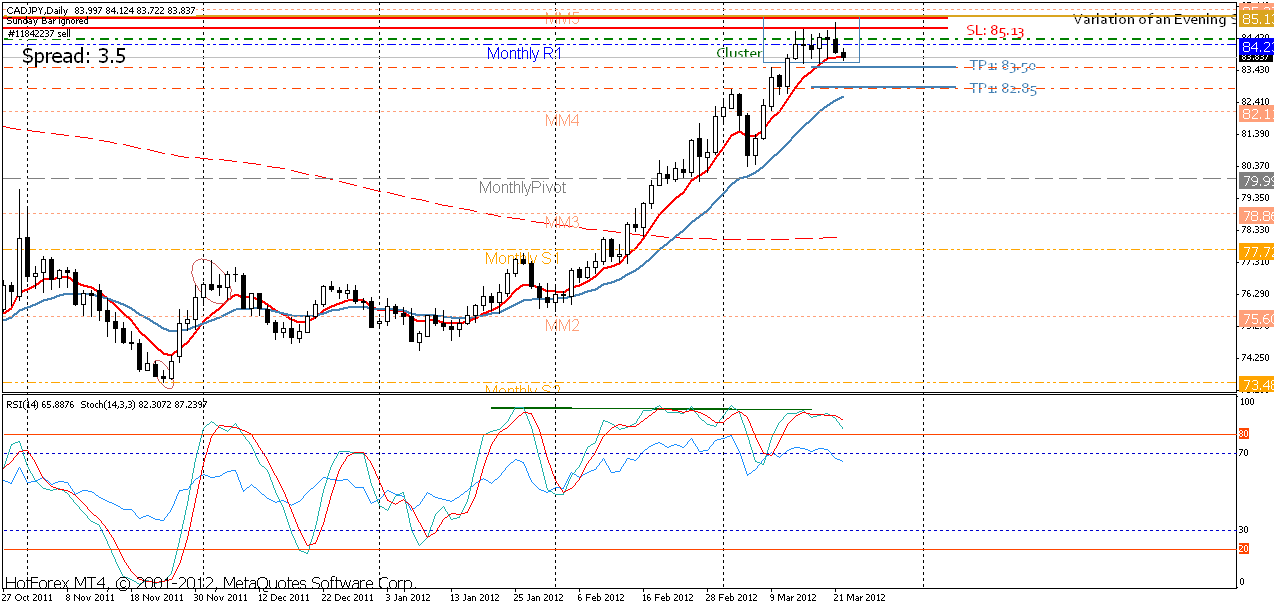
Entry: 84.394
SL: 85.13
TP1: 83.50
TP2: 82.85
Disclaimer: TRADE ON YOUR OWN RISK. THIS RECOMMENDATION IS MEANT FOR LEARNING PURPOSES ONLY.
It really depends on how you trade them. Basically, if you wanna do Day Trading I suggest you use Daily Pivot Points. If you wanna do Swing you’d rather use Weekly or Monthly. -Here is an interesting observation I’ve made. Look at monthly pivot points for example, almost (as far as I’ve checked) 100% of the time, when price reaches any level of monthly pivots, prices tend to bounce for at least 10-20 pips minimum. What this is telling us is that, either people are taking their profits, hitting stop/losses or people are entering new trades on those levels. I’ve never tried to come up with an idea on how to trade this sort of ‘strategy’ (if I could say so), but as an interesting idea, I urge you to analyze it and see if you can come up with something. Same goes with Weekly as well, but not as accurate as Monthly’s.
As for the Middle Lines, it’s just something I use and I’m sure other people use them as well for profit taking or stop/losses. The reason why I use Pivots instead of Fibonacci is because, Pivots are completely mechanical and very objective in contrary to Fibonacci where you can draw them anyhow you want. So that’s why I’m literally hooked on Pivots  .
.
Have fun.
CADJPY short trade first target hit.
Entry: 84.394
SL: 84.394
TP1: 83.50 — (Hit: +89.4 Pips)
TP2: 82.85 — Unchaged
Chart:
Both trades closed at their second profit targets.
CAD/JPY:
Chart:
Entry: 84.394
TP1: 83.50 - (+89.4 Pips)
TP2: 82.85 - (+154.4 Pips)
TOTAL: +243.8 Pips. (Account: +3.6%)
NZD/JPY:
Chart:
Entry: 68.376
TP1: 67.40 - (+97.6 Pips)
TP2: 66.70 - (+ 167.6 Pips)
TOTAL: 265.2 Pips. (Account: 3.2%
EURGBP still running.
Have fun.
Great trades Eric… Good setups… I am learning from you. Keep it up… 
As always good trading there GicaEric.
Keep it up:53:
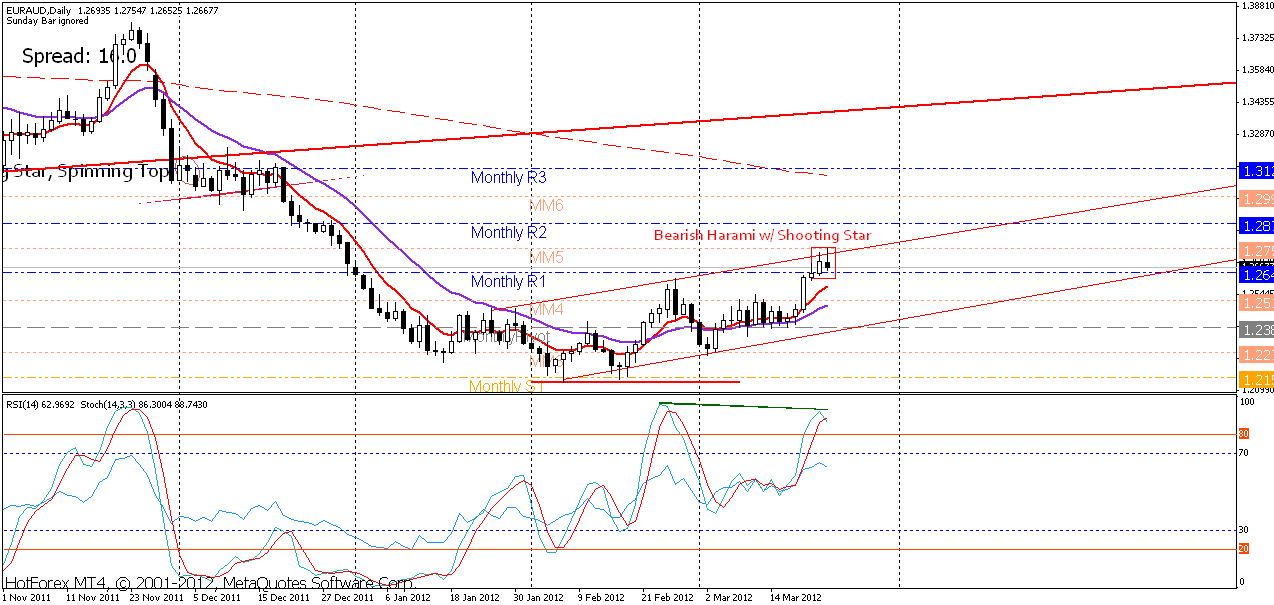
Here is an interesting candlestick formation on this EUR/AUD chart. It’s a Bearish Harami with a Shooting Star around an upper trendline channel. Also we got negative divergence on the Stochastic, so looking for an entry on this one.
Chart:
Good luck on this week.
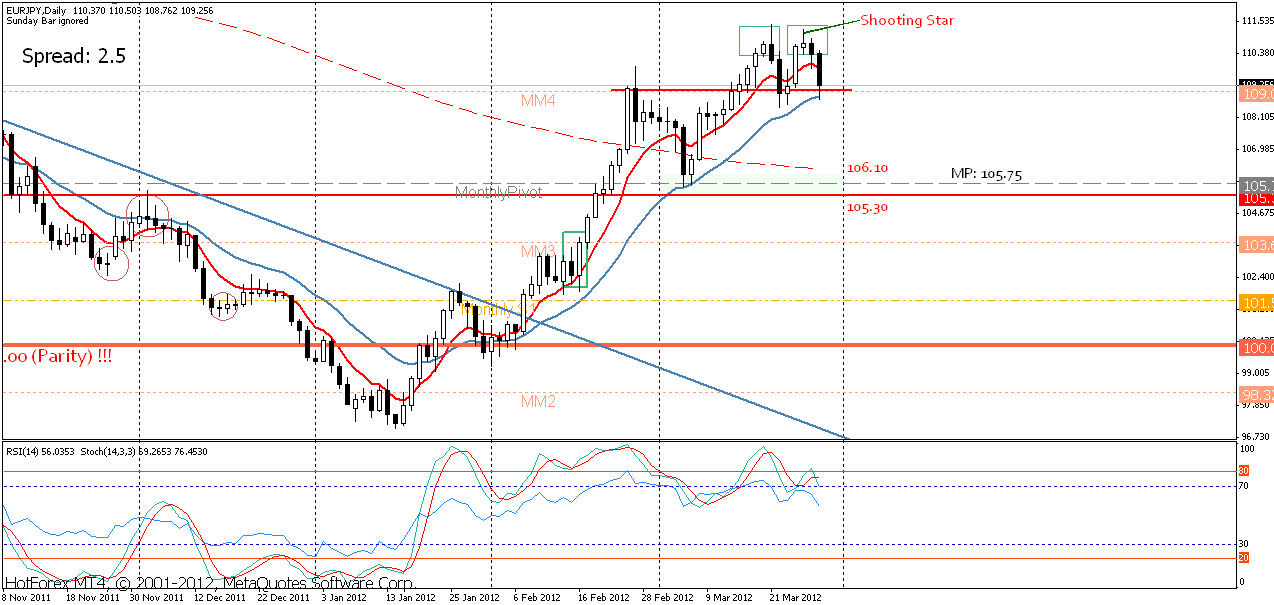
Hello Eric, here’s the trade i have traced on EURJPY. I see a double top formed, could this be a valid trade. If so, Can i enter after the bearish candle has formed completely after the spinning top ?
Sorry I could not reply you earlier. I’m caught up with something I needed to deal a long time ago. About the question. As it turned out, it would have been a nice idea to short after the Shooting Star, as a matter of fact, I would have traded this had I spotted it at the right time.
However, still, if you look at it, I has formed a Double Top pattern. Moreover, if you scale it to H4 timeframe, you can clearly see that Double Top formation coming into shape. Will I trade it? -I’m not really sure, I just don’t see a way to make it worth for a better R/R profile. If you have any ideas about this Double Top, please post them, we’ll see what we can do.
Cheers.
