Consistent FX Trading System

Hello guys,

I finally have some time on my hands, so i’ve decided to make a little contribution as a lot of people have been asking how i trade and what tools i use.

This is a complex of 3 Trading Systems. It is not a hybrid, i individually apply the each system to gauge the trend and price movement.

Before starting out i recommend you introduce yourself to the following material courtesy of Incredible Charts: Stock Trading Guide - Stocks and Shares

Bull markets[ul]
[li]Bull markets commence with reviving confidence as business conditions improve.[/li][li]Prices rise as the market responds to improved earnings[/li][li]Rampant speculation dominates the market and price advances are based on hopes and expectations rather than actual results.[/ul]Bear markets[ul][/li][li]Bear markets start with abandonment of the hopes and expectations that sustained inflated prices.[/li][li]Prices decline in response to disappointing earnings.[/li][li]Distress selling follows as speculators attempt to close out their positions and securities are sold without regard to their true value.[/ul]Ranging Markets[/li][ul]
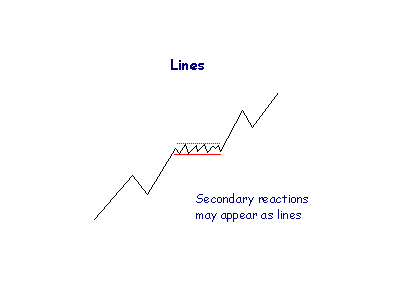
[li]A secondary reaction may take the form of a �line� which may endure for several weeks. Price fluctuates within a narrow range of about five per cent.Breakouts from a range can occur in either direction. [/li]Breakouts from a range can occur in either direction.

[/ul][ul]
[li]Advances above the upper limit of the line signal accumulation and higher prices;[/li][li]Declines below the lower limit indicate distribution and lower prices;[/ul] Trends[/li]
Bull Trends

  A bull trend is identified by a series of rallies where each rally exceeds the highest point of the previous rally. The decline, between rallies, ends above the lowest point of the previous decline.

[I]Successive higher highs and higher lows.

[/I] [B]

[/B]The start of an up trend is signaled when price makes a higher low (trough), followed by a rally above the previous high (peak):

Start = higher Low + break above previous High.

The end is signaled by a lower high (peak), followed by a decline below the previous low (trough):

End = lower High + break below previous Low.

 What if the series of higher Highs and higher Lows is first broken by a lower Low? There are two possible interpretations - see [Large Corrections](http://www.incrediblecharts.com/technical/dow_theory_trends.htm#Large+Corrections).

Bear Trends

Each successive rally fails to penetrate the high point of the previous rally. Each decline terminates at a lower point than the preceding decline.

Successive lower highs and lower lows.

        A bear trend starts at the end of a bull trend: when a rally ends with a lower peak and then retreats below the previous low. The end of a bear trend is identical to the start of a bull trend.


 What if the series of lower Highs and lower Lows is first broken by a higher High? This is a gray area - see [Large Corrections](http://www.incrediblecharts.com/technical/dow_theory_trends.htm#Large+Corrections).

[B]Large Corrections[/B]
A large correction occurs when price falls below the previous low (during a bull trend) or where price rises above the previous high (in a bear trend).

[IMG]http://www.incrediblecharts.com/images/png_images/large%20correction.png[/IMG]


  Some purists argue that a trend ends if the sequence of higher highs and higher lows is broken. Others argue that a bear trend has not started until there is a [lower High and Low](http://www.incrediblecharts.com/technical/dow_theory_trends.htm#Bear+Trends) nor has a bull trend started until there is a [higher Low and High](http://www.incrediblecharts.com/technical/dow_theory_trends.htm#Bull+Trends).


 For practical purposes: [B]Only accept large corrections as trend changes in the primary trend[/B]:


 �A bull trend starts when price rallies above the previous high,

�A bull trend ends when price declines below the previous low,
�A bear trend starts at the end of a bull trend (and vice versa).

 Now that you�ve had the opportunity to introduce yourself to some of the concepts we will be applying on a subconscious level, we can move towards an introduction of the systems we will be getting our feedback from.

[B]SYSTEM 1:[/B]
This is comprised of a basic MA setup. We won�t be using the system to trade, but just to gauge and provide supplemental, informative advice.

  The setup: 5 EMA to the High (YELOW), 5 EMA to the Low (YELOW), 50/60 EMA (BLUE), 20 EMA (RED)

  You should have something of the sort:

[B]USEAGE: [/B]

  • When the H and L, 5 EMA lines cross over 20 EMA decisively; you have a buy recommendation
    -When the H and L, 5 EMA lines cross over 50/60 EMA decisively; you have a buy confirmation
  This is pretty much as far as we will go to apply this system.

[B]SYSTEM 2:[/B]
Is based on fundamental trend line drawing principles. We will be working exclusively with charts starting H4 and up. In some rare occurrences we may move as low as H1.

  The concept is noob-simple to apply. Trading signals are produced when an H4 or H1 candle open over the depicted trend line. You can use a close if you wish, but that�s up to you.

  Example:

[B]SYSTEM 3:[/B]
Consists of trading a 9 candle break out.
We use this on the chart by creating a free hand line 9 candles in length.

  It will look like this on your chart (MT4):

   We will be using the extreme two components of this line.

The far left block is applied to the closing price of a candle such that the current candle on the chart coincides with the right block if a vertical line is drawn, making a 7 Candle difference between both extremities.

[B]USEAGE:[/B]
If the current candle in action opens above our 9 period line, it is an indication to BUY and vice versa for Short positions.

  NOTE: When looking for a long position the price must be in a decline and when looking for a short position the price must be rising. 

  By combining systems 1 and 2 with three we can better determine when we should accept long and short trades.

EXAMPLE:

Now lets take a look at a trade example. (Text corresponds to the chart below it not above)

  We have a chart nice and peeeeerty:

The first thing we do is look for a trend line to draw, so we have System 2 in first gear, then we take a look at the EMAs.

  From what is evident on this chart at the moment. The L and H 5 EMA lines are trending safely below the 20 EMA, which are both under 50/60 EMA; this is an indication of a healthy trend with no worries.

  The price is moving down. So we can expect three things to happen in all cases.

1.It continues moving down
2.It consolidates
3.It reverses

  Generally we would be in a short trade right now, so our aim would be on gauging trend health and determining the optimal point of exit and in such also for our next trade.

  We take a look at the 9 candle break. I�ve colored those candles in yellow just so u can make a visual correspondence. With the information we have we assume the following; since the current candle has not broke over the close 9 candles back, we accept bias to be bearish. We continue to look for a long signal.


 [IMG]http://img516.imageshack.us/img516/9720/t1di4.jpg[/IMG]


 Lets move to the next step.

  A few candles forward we see the price changing direction in a more aggressive manner and testing the trend line we�ve drawn. We take note of this and understand the fact that buyers are attempting to break out of the envelope that defines the current downtrend in an attempt to make Higher Highs and create a market environment attractive enough to other participants who can contribute in their own ways by adding fuel to the fire.

  We can note that 1 of the High 5 Period EMA has crossed over the trend line.

  We�ve moved the left end of our 9 period freehand line a close forward to reflect the current situation as a new candle has opened from which we can say the following; the current active candle has not broken over the close of 9 candles ago and is located below the 9 period line, hence we assume a bearish status.

Moving a candle further we note the following:
A new candle has opened above the trend line; We HAVE a buy signal on one of our systems.

  Lets check the next one in order of importance and quality of the signal produced.

  9 Period Line

Since a new candle has opened we�ve moved our 9 period line forward to the next candle close, such that it reflects the current situation from which we can conclude that the current active candle is still located below the 9 period line; hence we continue to maintain a bearish bias.

  EMAs: the High 5 EMA is out of the trend line, still waiting for the Low 5.

Our trend line system is our strongest indicator; there is no problem in entering after it issues its signal, but wait for the other systems if you wish to confirm further.

  -A second candle opens above the trend line, so we have yet another buy signal

  A few candles further, just so not to prolong this tutorial, we�ve moved the left extremity of our 9 period line to the next close in turn such that the right end coincides with the current candle on a vertical level. We note from the current situation that the current candle has [I]opened [/I]and broken over the 9 period line confidently.

  We now have a buy signal from our second system.

  EMAs: both the High and Low 5 EMAs have now broken over the trend line and we have several candle closes to solidify that. The High 5 EMA starts flirting with 20 EMA.

The confirmations continue stacking in on our trend line break and 9 period system.

  EMAS: both 5 High and Low break above 20 EMA, producing a buy recommendation.

  Don�t forget moving averages are extremely lagging indicators. This is expected.

The L and H 5 EMA break over 50. All systems are go.

    Use Support/Resistance and Fibonacci Extensions / Retracements to determine targets.

When you have a target, make your stop loss 30 to 50% of it.

  Good luck.

Hello, thank you for posting your system. I’m looking forward to trying it but I’m a newbie and there are some things that aren’t clear.

First of all, I’m not familiar with the 9 candle break out line. Is it an indicator? How exactly is it plotted on a chart and applied to the close of each new candle?

Second, what currency pair(s) work best with your system?

Third, can you give specifics about your method for determining support/resistance levels and the most recent lows and highs for Fibonacci? How far back do you look for these points?

Fourth, do you use trailing stops or just keep the stop 30 to 50% less than your target? And do you use take profits on your target or close the trade yourself?

Fifth, how do you decide which Fibonacci Retracement/Extension level to use as your target?

Sixth, with a 10,000 USD demo account, what leverage and lot size do you recommend per trade?

And I’m not sure I’m drawing my trendlines right, so can you take a look at this chart and tell me if it’s done correctly? The solid red line is the trendline. I also plotted Fibonaci Retracements levels and I’m not sure about those either.

Regards,
E. Lang

Damn Imageshack; my apologies guys, i will have to repost the pics later on my server.

Regards,
E. Lang

I can’t find where to draw a free hand line with MetaTrader 4. The closest thing is a horizontal line but that goes across the whole chart. And I can see all your images fine.

You need to draw a trendline (diagonal)

Then in its properties UNtick “RaY”

Regards
E. Lang

accuracy of ur system?, just approx i know no one can tell exact :smiley:

Over 80% confidently.

NOTE: When looking for a long position the price must be in a decline and when looking for a short position the price must be rising.

^^^^^^^^^^^^^^^^^^^^^^^^^^^^^^^^^^^^^^^^^^^

what do you mean by that? could you show a chart and explain it?

I understand the rest of the system. But does that mean if i am looking to go long i CAN NOT go long unless the last candle of the nine period opens above the close of the first candle AND is a Bearish candle?

2 Trades initiated using the trendline break and 9 period break system.

Entries are located at the open of the yellow candles.

Regards
E. Lang

CND GDP wasn’t too amusing and price reverse was pretty dramatic.

My position on this trade was closed out.

Thank god for stop losses.

I’ll make it back on the next trade + some.

I’m off for the weekend.

Have a good one everybody.

Regards,
R. Lang