HG#F (Copper) Elliott Wave View: Extension lower
HG#F (Copper) is showing 5 swings incomplete sequence from 2/13/2017 high, preferred Elliott wave view suggests rally to 2.619 completed 6th swing as a FLAT in wave (B) and metal has now resumed the decline in 7th swing. Decline from 2.619 is so far corrective so wave © is expected to take the form of an Ending diagonal where wave 1 ended at 2.539 and wave 2 ended at 2.581 as a FLAT. Near-term focus is on 2.526 – 2.500 area to complete 3 waves from wave 2 peak, this area can result in a bounce in 3 waves again which should fail below 2.581 high and more importantly below 2.619 high for extension lower towards 2.376 – 2.2716 area to complete 7 swings from 2/13/2017 high.
HG#F (Copper) 1 Hour Elliott Wave Chart 06/06/2017
Copper swings sequences calling the rally
Hello fellow traders. In this technical blog we’re going to take a quick look at the past Elliott Wave charts of Copper published in members area of elliottwave-forecast. In further text we’re going to count the swings, explain the short term Elliott Wave view.
Copper Elliott Wave 1 Hour Chart 10.10.2017
As our members know, Copper has had incomplete bullish sequences in larger time frames targeting 3.363 area. Consequently, we advised members to avoid selling and keep buying the dips in 3,7,11 swings. On 9th October Copper has made new short term high that made sequences bullish in the short term cycle as well. With new high we assumed that 9th swing is in progress. That means short term cycle from the 09/22 low is also having incomplete sequences . As of right now, 11th swings up are required to complete proposed cycle.
We’re labeling proposed cycle as a Triple Three structure. Second ((x)) connector is counted completed at 3.011 low and we’re about to complete short term x red pull back. As far as the mentioned level holds, we expect further rally.
Shortly after Copper found buyers , and make further separation from the 3.011 low, eventually breaking above 09/04 peak. Keep in mind market is very dynamic. If you’re interested in new Elliott Wave forecasts of Copper you can find them in the membership area of EWF.
Elliott Wave Analysis: Copper at Risk of Further Weaknesses
Copper (HG_F) broke below $3.5 low ($3.095) earlier today. As a result, it shows a bearish sequence from 2/16 peak ($3.272), risking for further downside. Current short term Elliott Wave view in Copper suggests that the rally to $3.272 on 2/16 ended Primary wave ((X)). The decline from there is unfolding as a double three Elliott Wave structure where Intermediate wave (W) ended at $3.0955 on 3/5 and Intermediate wave (X) ended at $3.178 on 3/6. Intermediate wave (Y) remains in progress, and while near term bounces stay below $3.178, Copper should see further downside.
Internal of Intermediate wave (W) unfolded as a zigzag Elliott Wave structure where Minor wave A of (W) ended at $3.164 on 2/21, Minor wave B of (W) ended at $3.243 on 2/23, and Minor wave C of (W) ended at $3.0955 on 3/5. A zigzag structure has a 5-3-5 subdivision and the chart is showing a nice 5 waves impulse Elliott Wave structure subdivision within Minor wave A and Minor wave C.
Intermediate wave (X) correction from $3.0955 low has a subdivision of a zigzag Elliott Wave structure. Minor wave A of (X) ended at $3.142, Minor wave B of (X) ended at $3.129, and Minor wave C of (X) ended at $3.179. Decline from $3.179 appears to be unfolding as a zigzag with first leg Minor wave A subdivided as 5 waves. Minute wave ((i)) of A ended at $3.1175, Minute wave ((ii)) of A ended at $3.1445, Minute wave ((iii)) of A ended at $3.0705, Minute wave ((iv)) of A ended at $3.087, and Minute wave ((v)) of A appears complete at 3.055. Minor wave B bounce is in progress to correct cycle from 3/6 high in 3, 7, or 11 swing. While Minor wave B bounce stays below $3.179, expect Copper to extend lower.
Copper 1 Hour Elliott Wave Chart
Elliott Wave View: Copper Starts a New Leg Higher
Short Term Elliott Wave view in Copper suggests that the decline to 2.938 on 3.26.2018 ended Minor wave IV. The metal started a new leg higher from there in Minor wave V. Subdivision of Minor wave V is unfolding as an impulse Elliott Wave structure. An Impulse Elliott Wave structure is a 5 waves structure where wave 1, 3, and 5 subdivision are also internally in 5 waves (impulsive). In the case of Copper, up from 2.938, Minutte wave (i) ended at 3.024, Minutte wave (ii) ended at 2.968, Minutte wave (iii) ended at 3.072, and Minutte wave (iv) ended at 3.037.
Near term focus is on 3.081 – 3.095 to complete Minutte wave (v). This next leg higher in Minutte wave (v) should end Minute wave ((i)) of a larger degree. Copper should then pullback in Minute wave ((ii)) in 3, 7, or 11 swing to correct cycle from 3/26/2018 low before the rally resumes, provided pivot at 2.938 low stays intact. We don’t like selling the proposed pullback and expect buyers to appear while Minute wave ((ii)) dips stay above 2.938 low.
Copper Elliott Wave 1 Hour Chart
Copper Elliott Wave View: Next Extension Higher may have started
Copper ticker symbol: HG_F short-term Elliott wave view suggests that the pullback to 3.0101 on 5/30/2018 ended Intermediate wave (2). The internals of Intermediate wave (2) unfolded as Elliott wave double three structure where Minor wave W ended at 3.0195. Minor wave X ended at 3.1485 high and the decline to 3.0101 low ended Minor wave Y of (2).
Above from there, the metal has started the next extension higher in intermediate wave (3). The rally looks to unfolding as Elliott wave impulse with extension in Minor wave 3 higher. The internal sub-division of Minor wave 1 and 3 show 5 waves distribution, confirming the impulse structure. Up from 3.0101 low, the rally to 3.093 high ended Minor wave 1 in 5 waves structure. Afterwards, the pullback to 3.046 low ended Minor wave 2 and Minor wave 3 rally remains in progress and expected to complete soon. Once Minor wave 3 ends, Minor 4 pullback should take place in 3, 7 or 11 swings to correct cycle from 5/31 low before the metal extends higher again in Minor wave 5 to complete the 5 waves impulse structure from 3.0101 low within intermediate wave (3) higher. We don’t like selling the metal into a proposed pullback.
Copper 1 Hour Elliott Wave Chart
In this blog, I want to share some short-term Elliott Wave charts of C opper which we presented to our members in the past. Below, you see the 1-hour updated chart presented to our clients on the 10/20/18 indicating that C opper ended the cycle from 09/21/18 peak in red wave W at 11/01/18 low (2.6435).
As C opper ended the cycle from 09/21/18 peak, we expected a bounce to occur in red wave X. Above from that low 11/01/18 low (2.6435), the bounce unfolded in an Elliott Wave flat structure. We advised members that C opper ideally should continue lower. Therefore, we expected sellers to appear in the sequences of 3, 7 or 11 swings. At the 100 - 1.236 Fibonacci extension of black ((a))-((b)) which came at around 2.8458-2.8894 area and that was the first area for sellers to appear.
C opper 11.20.2018 1 Hour Chart Elliott Wave Analysis
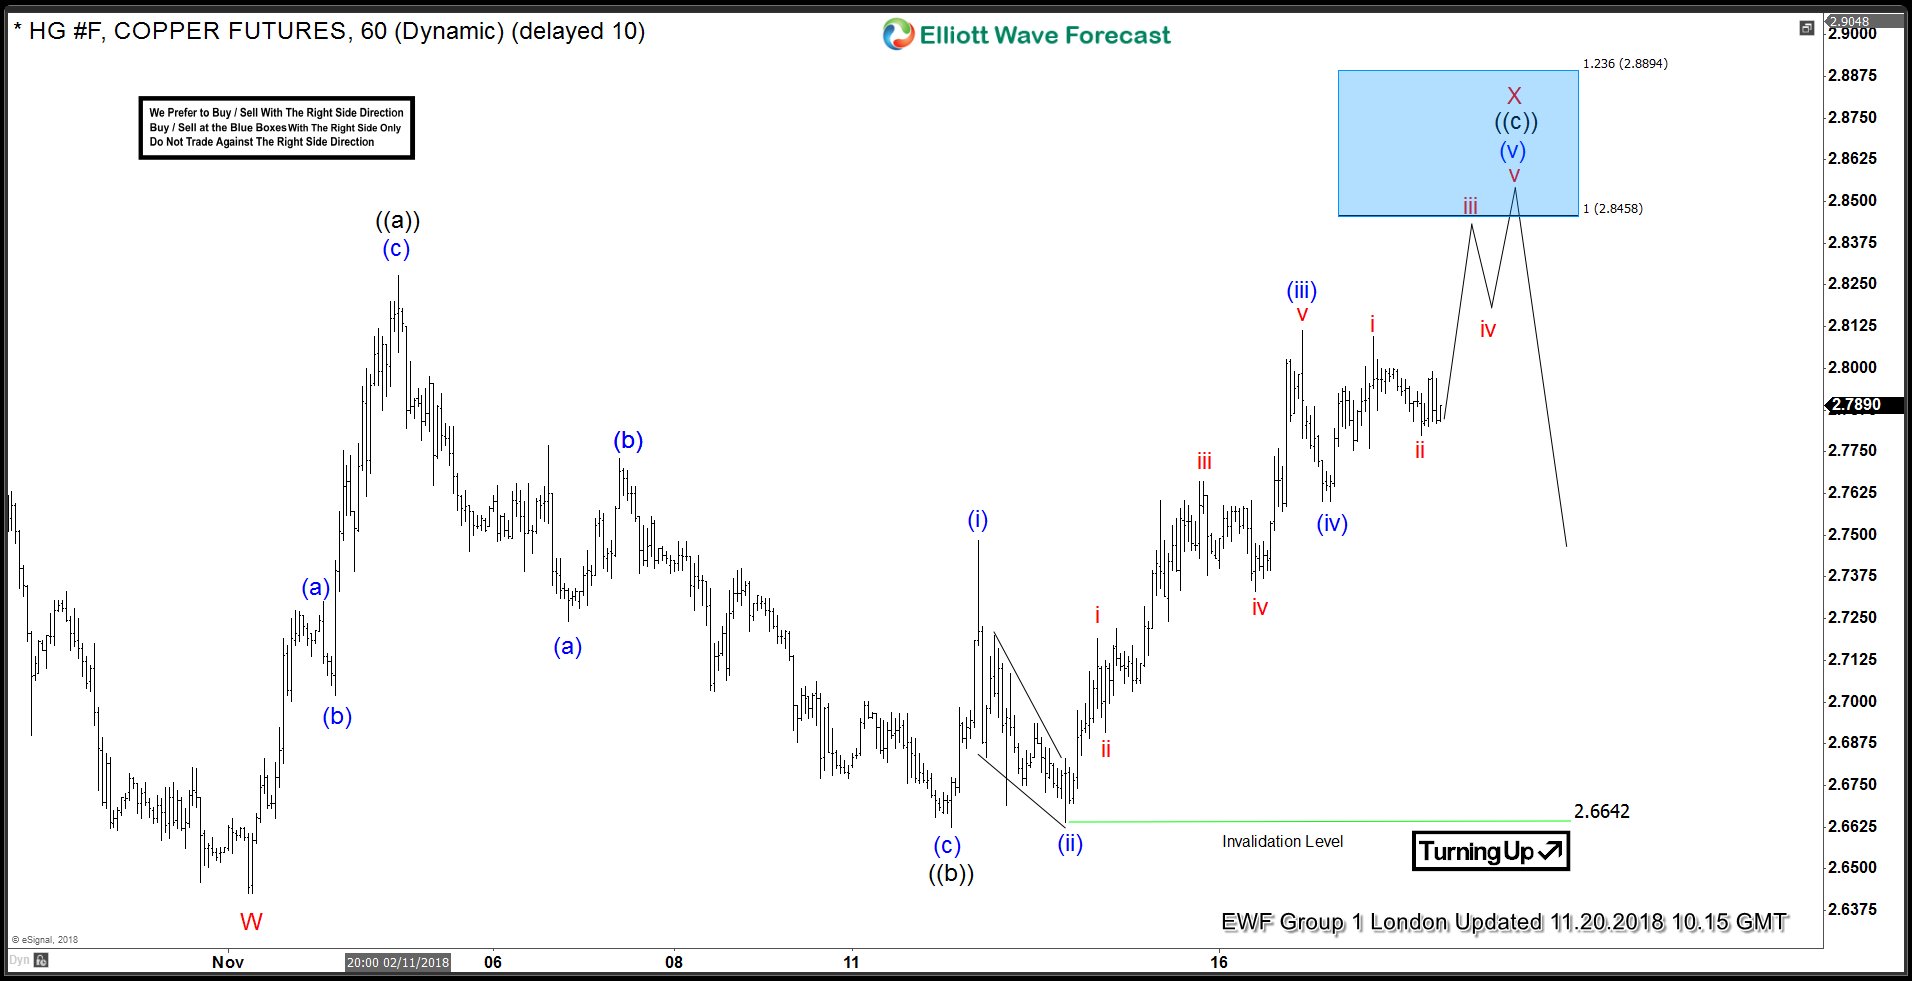
In the last Elliott Wave chart, you can see that the metal reached the blue box area (2.8458-2.8894) and reacted lower and also is close took price below red wave W low. If traded our blue box area shown in the chart above. Then, any trades from that area were risk-free, which means the stop-loss should be moved to break even, targeting lower levels. Do please keep in mind that the 1-hour chart which I presented may have changed already. This blog should just illustrate how accurate our blue boxes are, and how our members trade our 3-7 or 11 swings strategy.
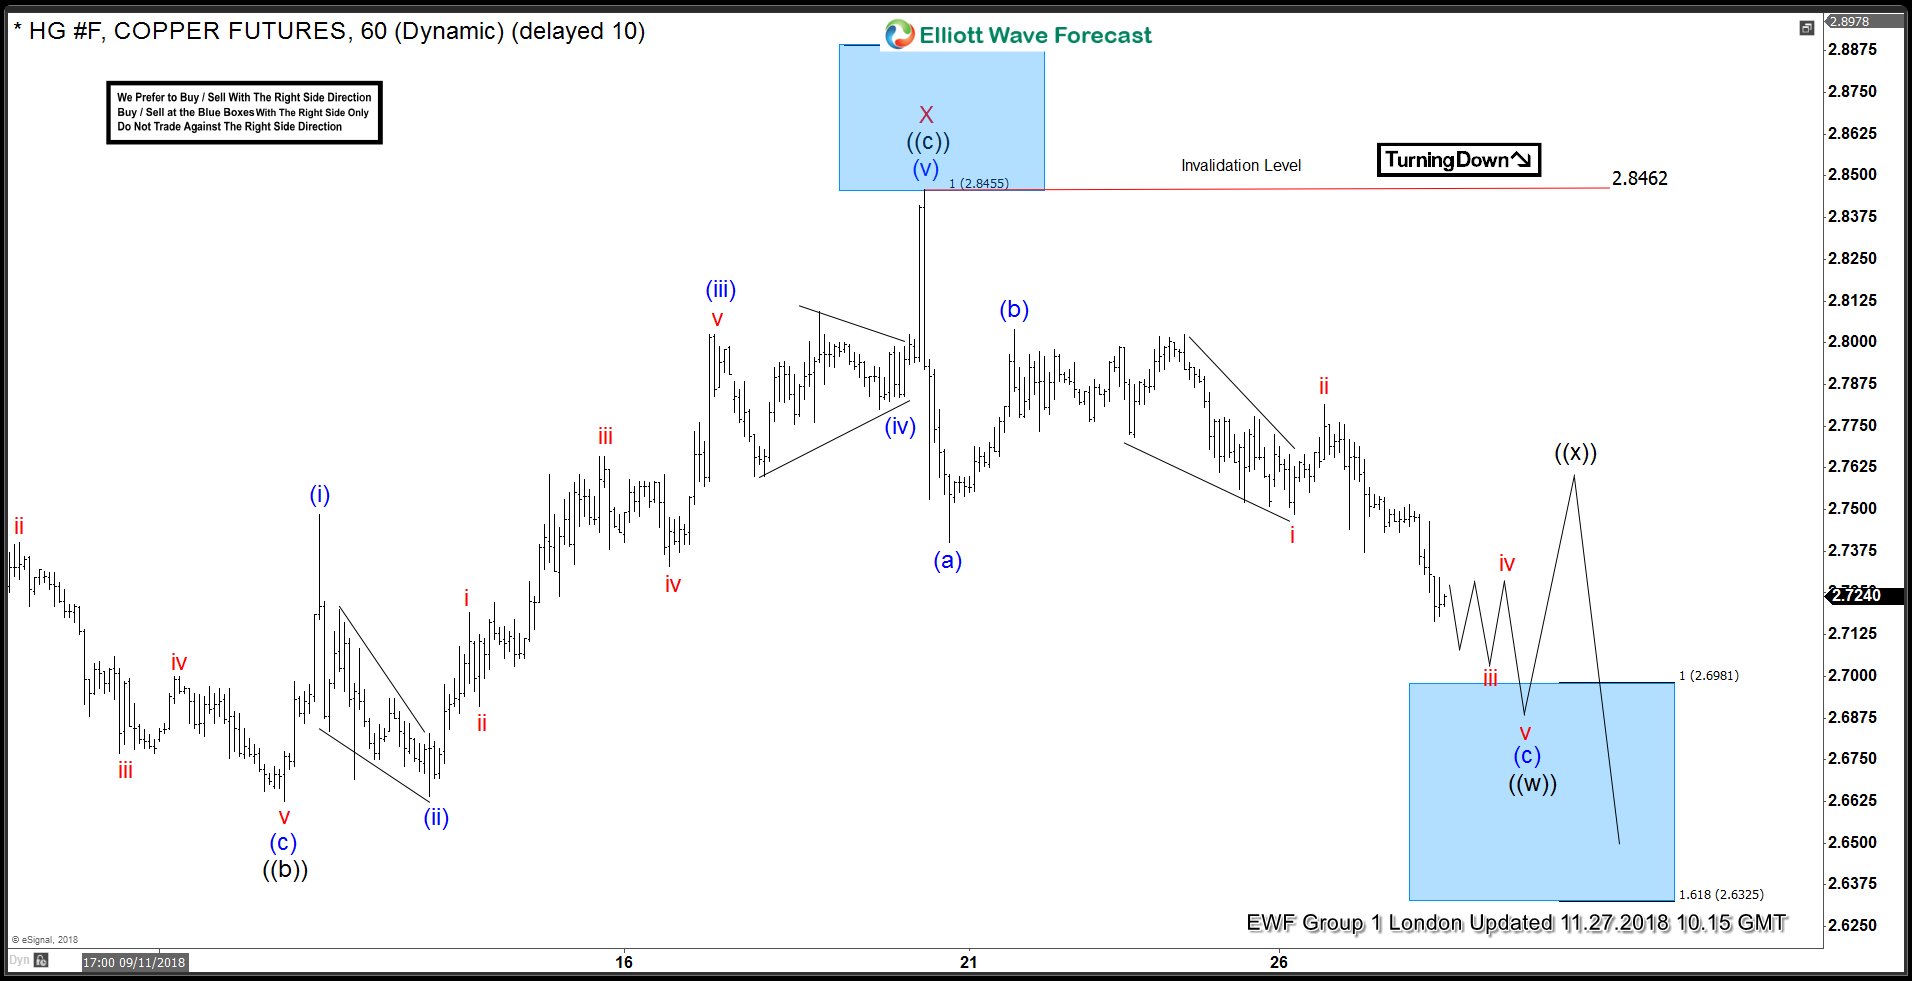
C opper 11.27.2018 1 Hour Chart Elliott Wave Analysis