In this technical blog we’re going to take a quick look at the Elliott Wave charts of CORN ( $ZC_F) published in members area of the elliottwave-forecast.com . As our members know, CORN ended cycle from the 352’3 low as 5 waves structure. We got 3 waves pull back , when the price reached Equal Legs - Blue Box. Commodity found buyers there as we expected. In further text we’re going to explain Elliott Wave Forecast.
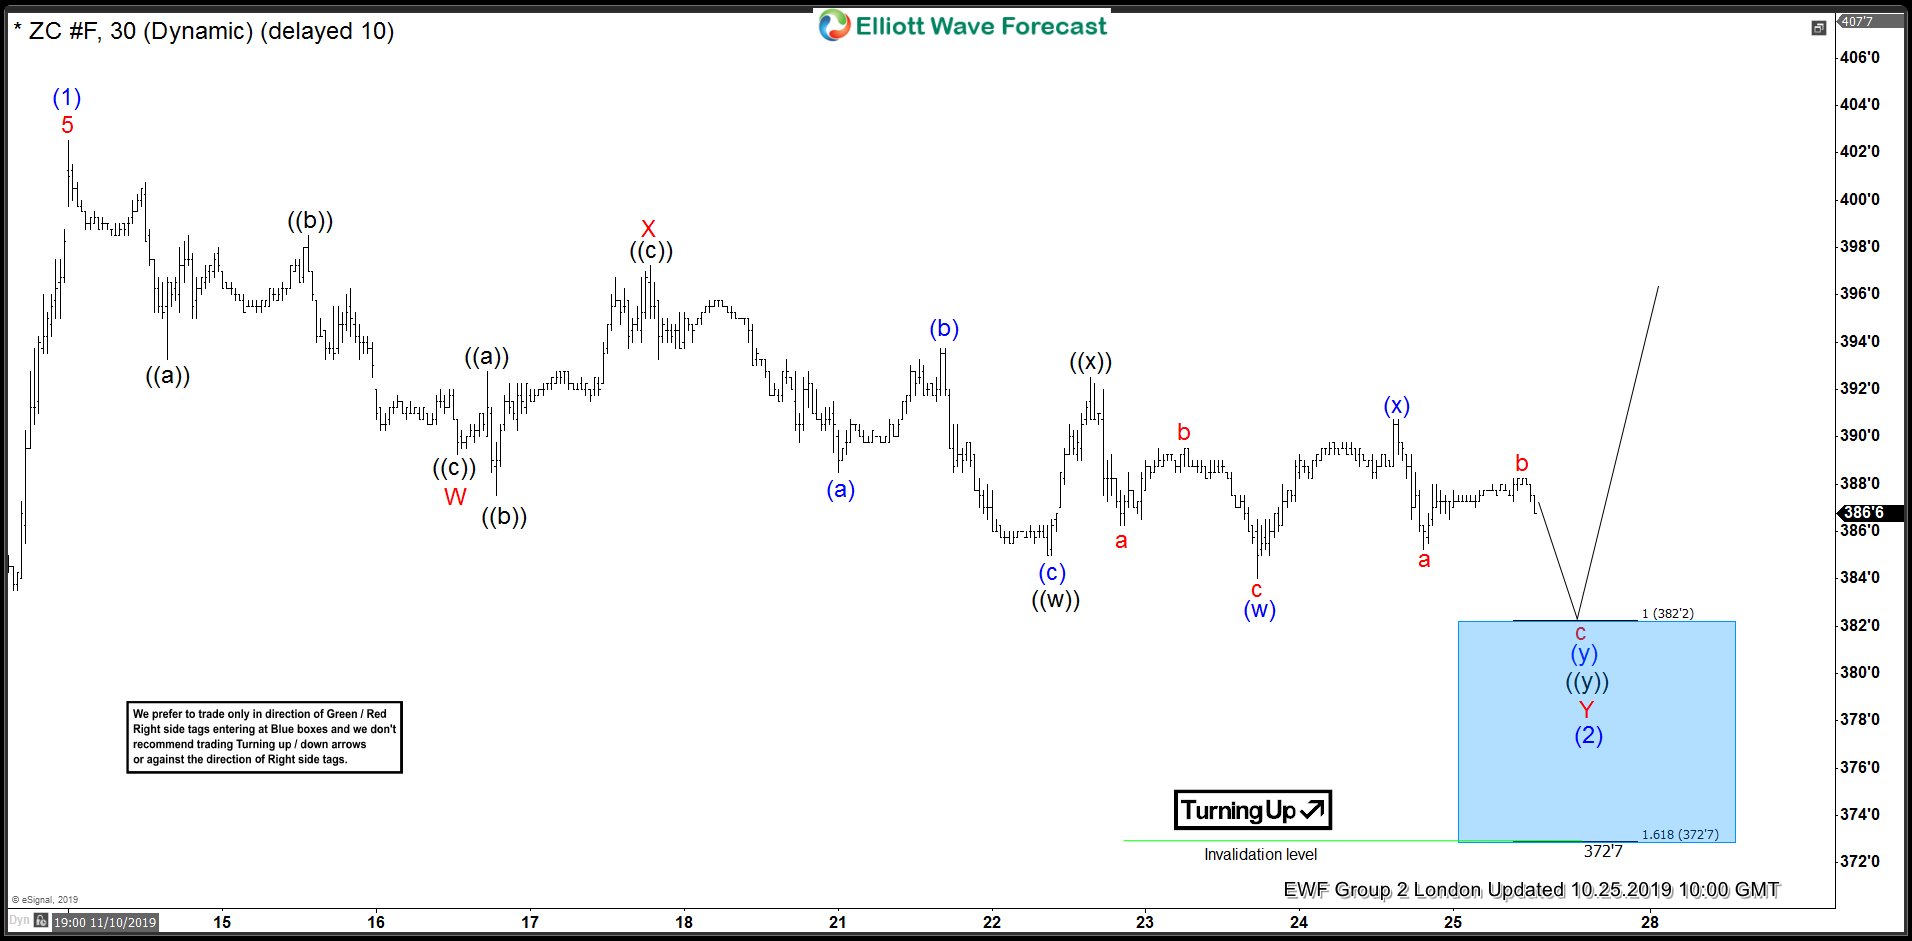
CORN 1 Hour Elliott Wave Analysis 10.25.2019
Corn is correcting the cycle from the 352’3 low. Pull back is unfolding as Elliott Wave Double Three Pattern. Short term pull back looks incomplete at the moment. The price is showing lower-low sequences from the 10/14 peak, missing another short term swing down. We expect pull back to reach 382’2-372’7 ( blue box- buyers zone). As our members know, Blue Boxes are no enemy areas , giving us 85% chance to get a reaction from there. We expected buyers to appear at the blue box for a proposed rally or 3 waves bounce alternatively.
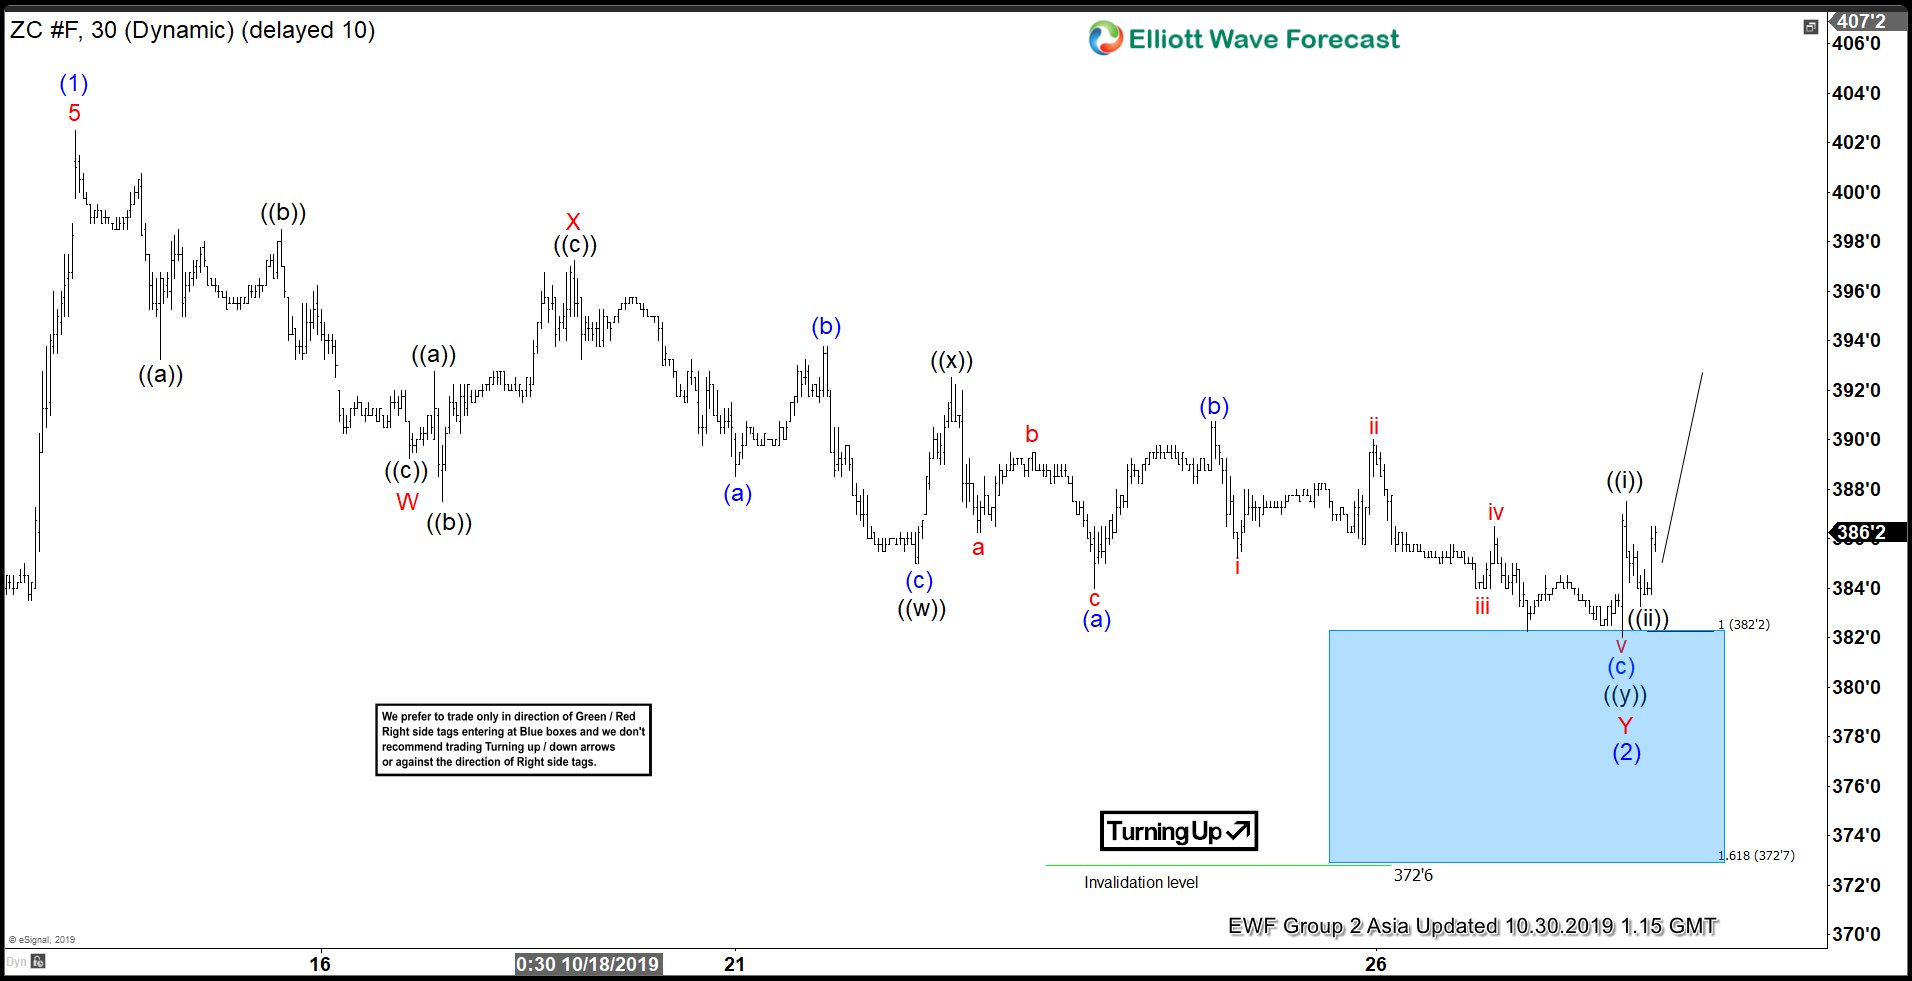
CORN 1 Hour Elliott Wave Analysis 10.30.2019
Eventually Corn made proposed leg down and found buyers right at the equal legs- upper line of the blue box: 382’2 . At this stage we are calling Wave (2) pull back completed at the 382’1 low as Double Three Pattern. However,reaction is pretty shallow so far. We need to see further separation from the low to get confirmation that pull back is completed. Anyway, we expect to get 3 waves bounce at least from the marked Blue Box area.
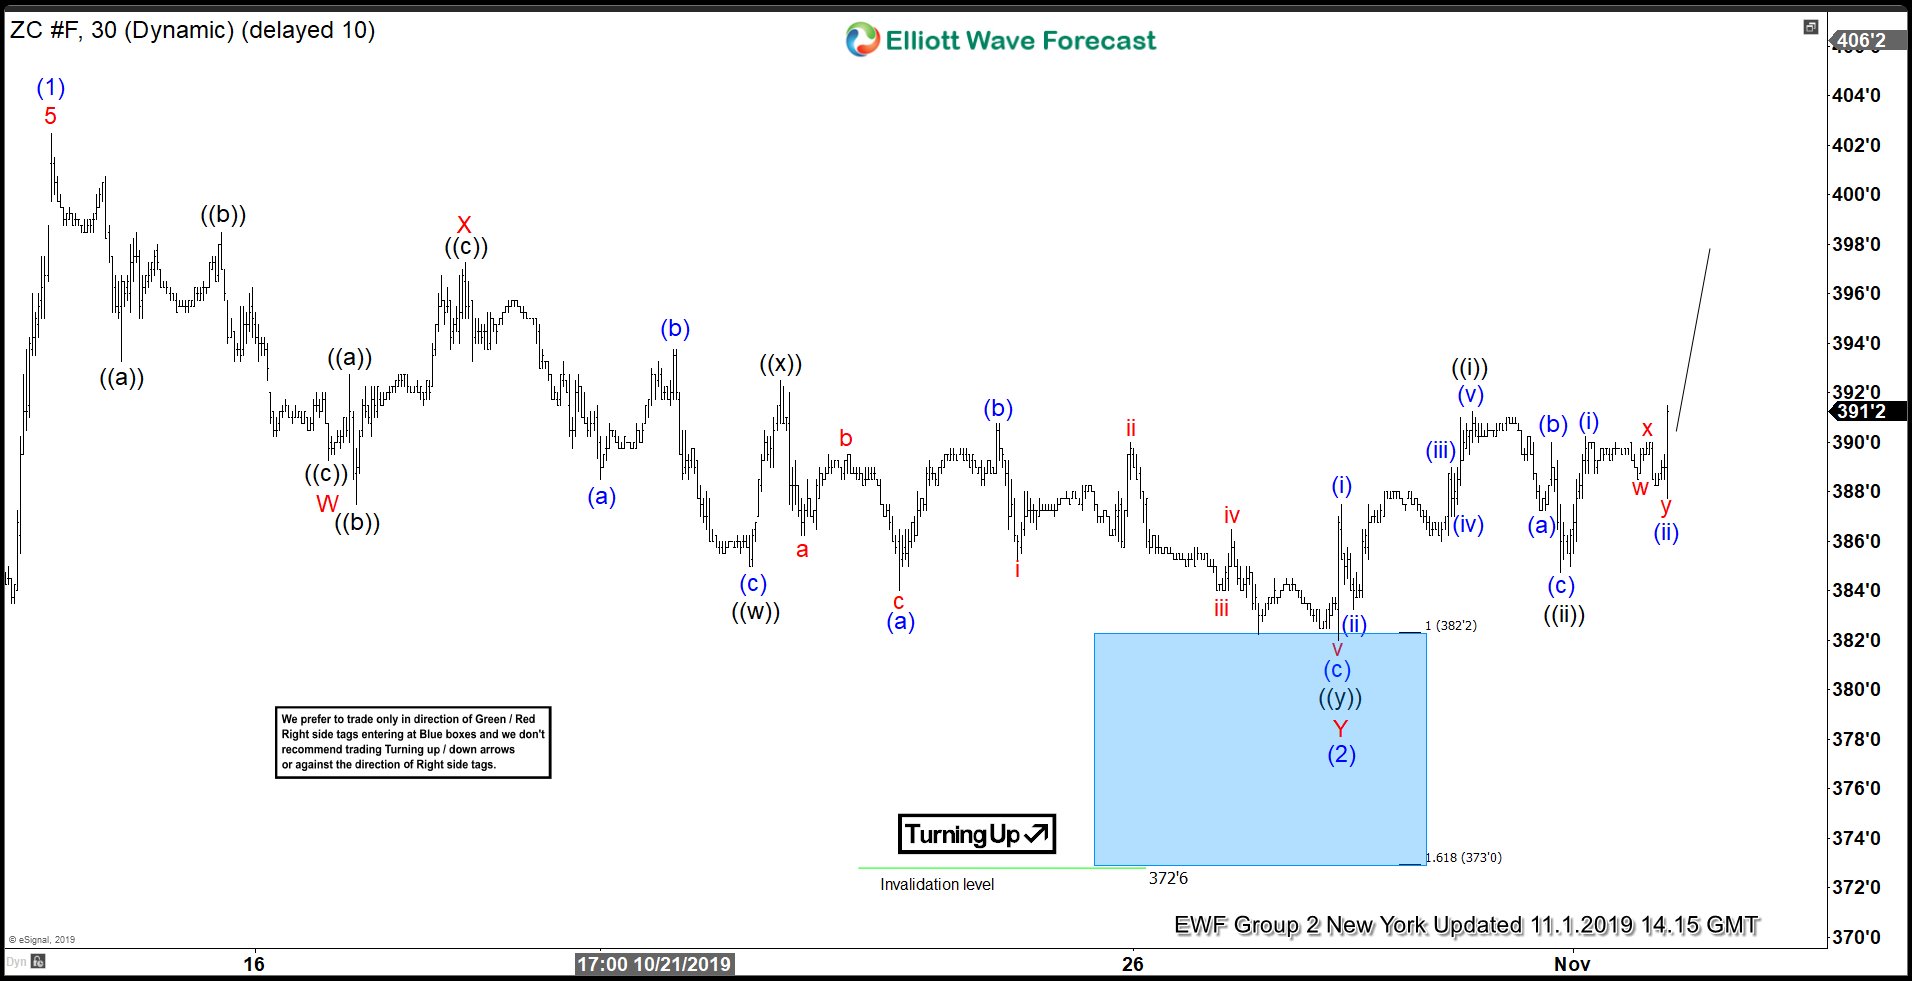
CORN 1 Hour Elliott Wave Analysis 11.1.2019
382’1 low held nicely during the short term pull back and we got separation from that low. The price has already reached 50 Fibs against the X red high and we got confirmation that cycle from the 10/14 peak is done. As far as the price stays above wave ((ii)) and more importantly wave (2) lows, we expect to get further strength in the commodity. We don’t advise forcing the trades at this stage. We would like to see break of 10/14 peak before buying intraday dips.
Keep in mind market is dynamic and presented view could have changed in the mean time. You can check most recent charts in the membership area of the site. Not every chart is Trading Signal. Best instruments to trade are those having incomplete bullish or bearish swings sequences. We put them in Sequence Report and best among them are shown in the Live Trading Room.