Everyday,we see all sort of analysis as if thats the most important thing in trading.We hear stuffs like ‘A break/close above this support/resistance/ trendline could result in this or that’. The forex market is decentralized and the chart are the same everywhere. The only difference is the ask and bid price being displayed by the brokers. Which means the market marker knows how the retail traders react at some levels in the market.They know what we thinking at those levels and they tend to take advantage of that. I have seen countless times price breaking a key levels inducing traders to take a trade then suddenly reversed direction. This often leads to frustration amongst traders. So, how do we develop immunity against this?
Wyckoff 2nd law of cause and effect implies that price movement (up and down) should be proportional to efforts(volume) supplied.i.e price is not subject to gravity, without volume it cannot move…So,i developed a tool that acts a lie detector for price action. It identifies candles with increasing volume,so the idea that movement on a candle where volume has decreased is suspicious.
Taking things from the opposite perspective, this tools reveals the more meaningful candles on your chart, > the ones telling the truth. The candlestick are therefore categorised into 3
- Candles with decreasing volumes(bull/bear)
- Candles with increasing volume (bull/bear)
- Candles with increasing volume above EMA.
Furthermore, Giving this tool out without manuals and guide on how to apply it wont be making enough sense as for their are also novice traders who would love to utilize this tools. So,there will also be a guide on how to apply this as a strategy and how to use it to improve your strategies.
In conclusion, i sincerely don’t know what will happen on the right side of the chart,i only know that i have a strategy that gives me entry to whatever the price action is.I prefer trading like a strategists not an analyst.Due to policy reasons,i will try my best to give detailed guides on how to use this.
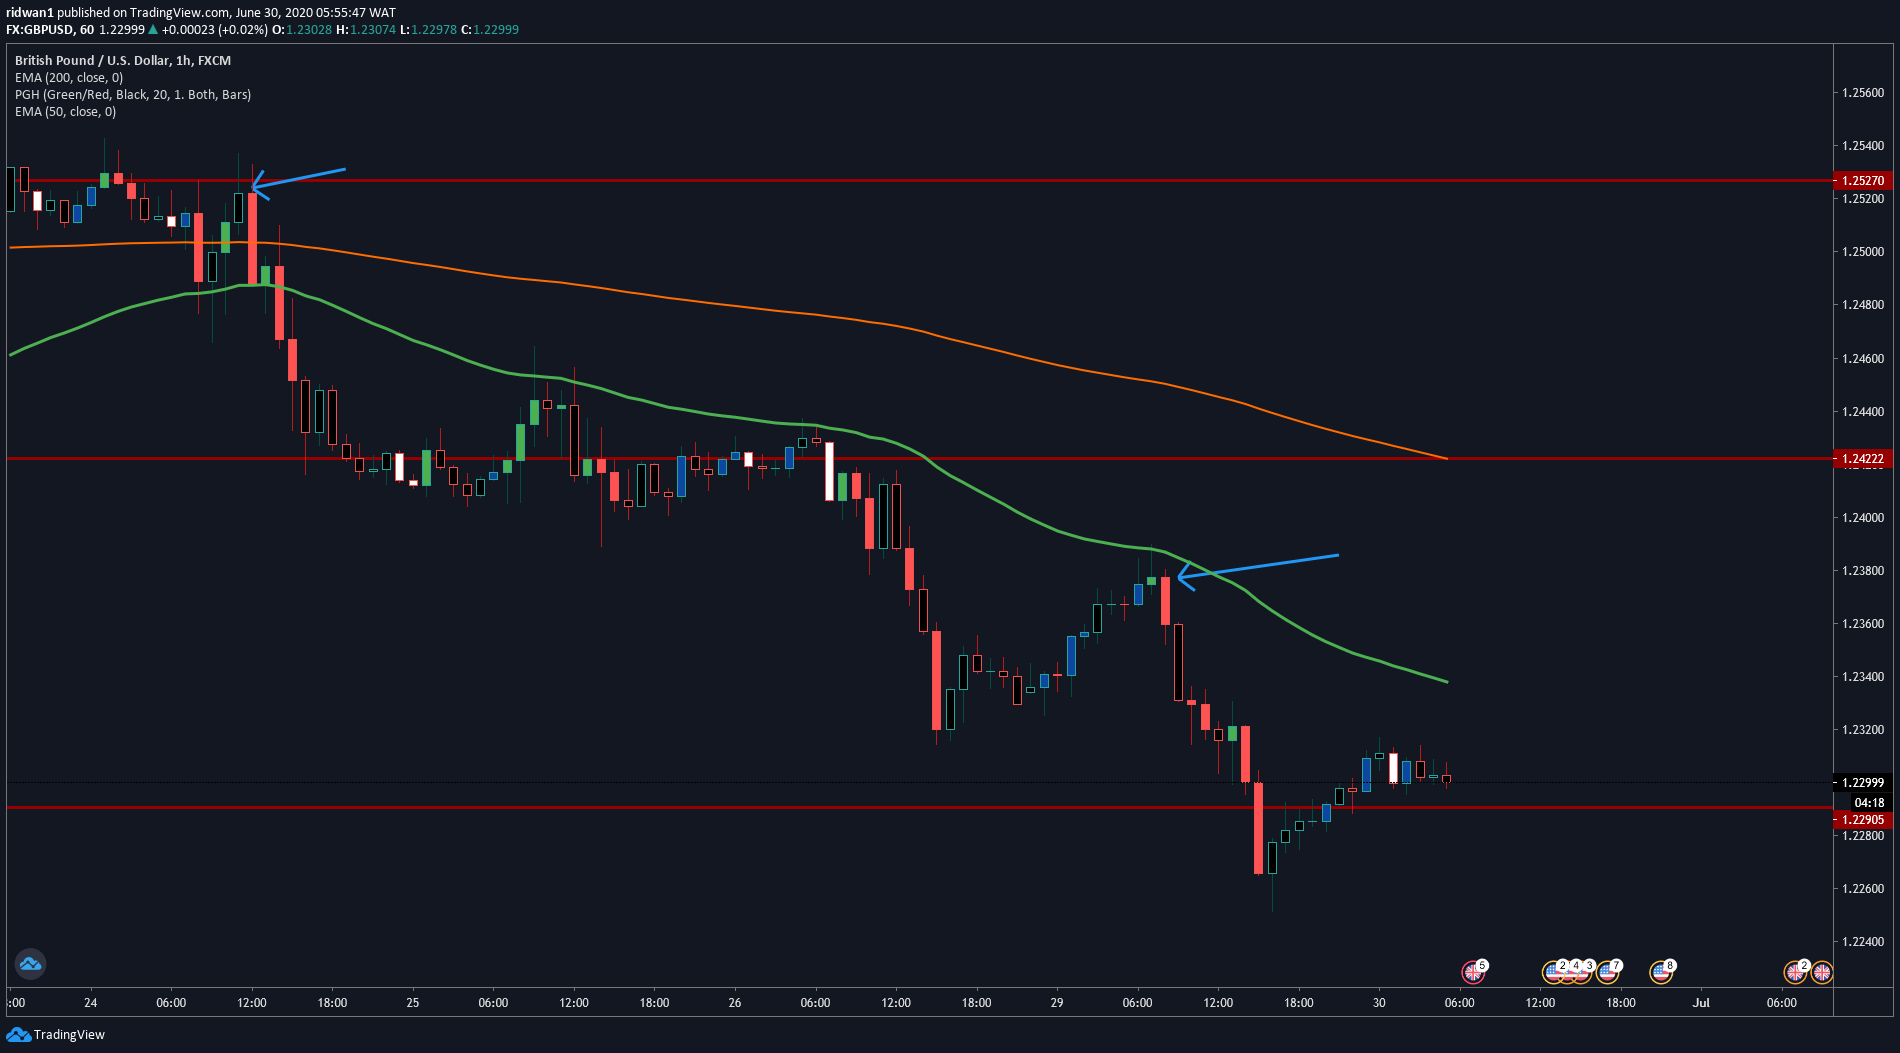
Here’s what the chart looks like.