[B]Market Overview by FXCC July 3 2012
US Markets closed tomorrow, ECB and BoE rate decision due on Thursday and US Nonfarm Payroll on Friday…
Asian equities have surged drastically and are up by 1.50%, whereas the US markets closed mixed. On the economic front today, we have U.K’s PMI construction and Net Consumer Credit data, which is expected to come in lower than before. From the Eurozone, the PPI data is expected to come in slightly positive. The dollar index, which compares the US unit to a basket of other currencies, was trading at 81.888 on Monday, up from 81.658 in North American trade late Friday.
US manufacturing shrank in June for the first time in nearly 3-years, adding to signs of a slowdown in the recovery but raised hopes for more easing from the Federal Reserve. Iran’s National Security and Foreign Policy Committee has drafted a bill calling for Iran to try to stop oil tankers from shipping crude through the Strait of Hormuz helped curb oil price losses, especially for Brent crude
Read More
https://support.fxcc.com/email/technical/03072012/
UPCOMING EVENTS :
2012-07-03 08:30 GMT | UK - Consumer Credit (May)
2012-07-03 09:00 GMT | EMU - Producer Price Index (May)
2012-07-03 13:45 GMT | US - ISM New York index (Jun)
2012-07-03 14:00 GMT | US - Factory Orders (MoM) (May)
FOREX NEWS :
2012-07-03 04:36 GMT | RBA leaves rates unchanged; monetary policy appropiate
2012-07-03 04:11 GMT | GBP/USD quiet around 1.5700; UK data ahead
2012-07-03 03:33 GMT | USD/JPY jumps to session highs 79.80
2012-07-03 02:20 GMT | EUR/NZD threatening all-time lows
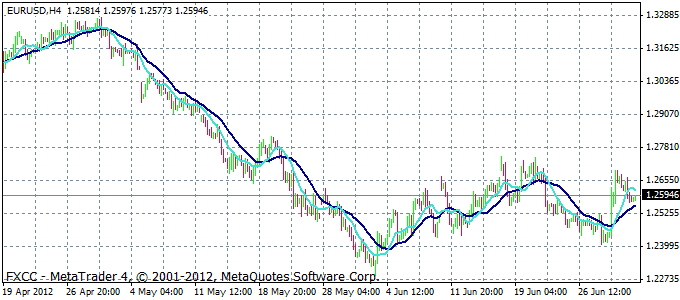
EURUSD : 1.25970 / 1.25973
DAILY WEEKLY MONTHLY

1.2742 | 1.2705 | 1.2642
1.2542 | 1.2505 | 1.2442
SUMMARY : Neutral
TREND : Up trend
MA10 : Bullish
MA20 : Bullish
STOCHASTIC : Neutral
MARKET ANALYSIS - Intraday Analysis
The euro has managed to sustain above 1.2575 level, and it may test higher levels of 1.2890, which is a 50% Fibonacci retracement level for the 1.3486-1.2286 range, in the near term. The RSI -14 momentum indicator is currently trading at 0.40 and is inching higher, supporting up move in the pair. Expect the euro to continue it’s up move. The supports are at 1.2575 then 1.2477 and resistances are at 1.2742 then 1.2890. The pair tested the 8-period EMA on the weekly charts, but did not manage to close above it.
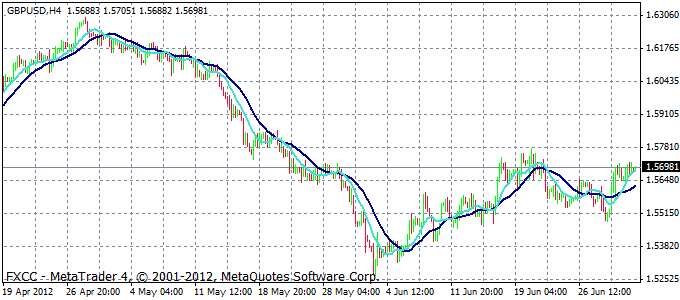
GBPUSD : 1.56962 / 1.56972
DAILY WEEKLY MONTHLY

1.5808 1.5765 1.5728
1.5648 1.5605 1.5568
SUMMARY : Up
TREND : Up trend
MA10 : Bullish
MA20 : Bullish
STOCHASTIC : Oversold
MARKET ANALYSIS - Intraday Analysis
The weekly chart indicates the pair forming a “triple-bottom pattern”. Currently, the GBP is trading above the 38.2% Fibonacci retracement level of the downward rally (1.6301-1.5265). The RSI-14 momentum indicator is hovering at 0.47 with a positive bias. Expect the pound to move higher and test levels of 1.5780. A break above this level will bring forth the next resistance at 1.5910, or 61.8% retracement level. Meanwhile, supports are evident at 1.5583 of a trendline and then at 1.5500
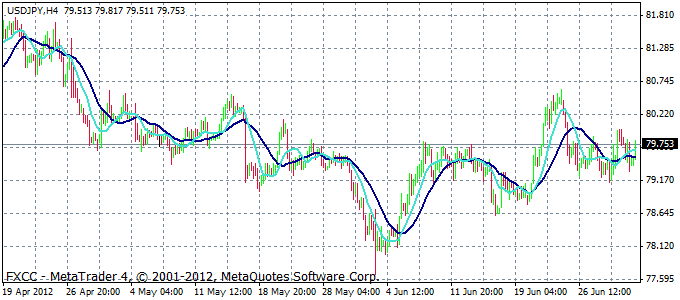
USDJPY : 79.743 / 79.747
DAILY WEEKLY MONTHLY

80.310 | 80.085 | 79.770
79.225 | 79.000 | 78.685
SUMMARY : Neutral
TREND : Sideway
MA10 : Bearish
MA20 : Bullish
STOCHASTIC : Overbought
MARKET ANALYSIS - Intraday Analysis
The charts indicate the support of a trend line drawn connecting the lower bottoms. The RSI-14 has been hovering around 0.50 for the last few weeks and is not indicating a clear trend for the pair. Expect the yen to once again test the lower trend line supports of 79.40-79.50 and to rebound from the same. If the yen manages to sustain above 80.18, which is the 38.2% Fibonacci retracement level for the 84.17-77.66 range, then the pair may test higher levels of 80.95. Supports are at 79.50 then 79.10 and resistances are at 80.17 then 80.94.
Source: FX Central Clearing Ltd, (ECN Forex Trading | ECN Forex Broker | Forex Trading Accounts | FXCC)[/B]


