[B]FxGrow Daily Technical Analysis – 24th March, 2016[/B]
[I]By FxGrow Research & Analysis Team[/I]
[B]USDJPY - rebound in progress[/B]
In last analysis I indicated the triangle pattern, as you can see it was broken down. After that declines accelerated, however once again support at 110.90 stopped them and caused rebound. Since the beginning of current week price is moving up and resistance at 111.70 was successfully broken.
[B][I]To read this Full in depth Analysis please visit FxGrow.[/I][/B]
[I][B]Note:[/B] This analysis is intended to provide general information and does not constitute the provision of INVESTMENT ADVICE. Investors should, before acting on this information, consider the appropriateness of this information having regard to their personal objectives, financial situation or needs. We recommend investors obtain investment advice specific to their situation before making any financial investment decision.[/I]
[B]FxGrow Daily Technical Analysis – 24th March, 2016[/B]
[I]By FxGrow Research & Analysis Team[/I]
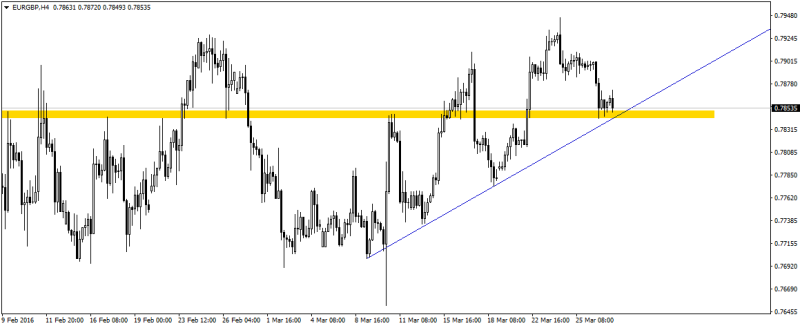
[B]EURGBP - 16-months high[/B]
Since the beginning of December 2015 EURGBP moved in strong uptrend. Short correction which started one month ago probably was finished. New 16-months high confirms that correction was ended.
If price keeps standing above 0.7910 next important resistances will be located at 0.8000 and 0.8150 (strong resistance and long term downtrend line which connects highs since January 2009 coincide in this area).
[B][I]To read this Full in depth Analysis please visit FxGrow.[/I][/B]
[I][B]Note:[/B] This analysis is intended to provide general information and does not constitute the provision of INVESTMENT ADVICE. Investors should, before acting on this information, consider the appropriateness of this information having regard to their personal objectives, financial situation or needs. We recommend investors obtain investment advice specific to their situation before making any financial investment decision.[/I]
[B]FxGrow Daily Technical Analysis – 25th March, 2016[/B]
[I]By FxGrow Research & Analysis Team[/I]
[B]GBPCAD - support at 1.8540 stopped declines[/B]
Last week supply tried again to broke support at 1.8540 but that attempt failed. Since Wednesday rebound is in progress and upward movement should test at least 1.8830 area. If bulls will be strong enough even 1.9080 level may be tested. Currently there isn’t any positive signs for bulls.
[B][I]To read this Full in depth Analysis please visit FxGrow.[/I][/B]
[I][B]Note:[/B] This analysis is intended to provide general information and does not constitute the provision of INVESTMENT ADVICE. Investors should, before acting on this information, consider the appropriateness of this information having regard to their personal objectives, financial situation or needs. We recommend investors obtain investment advice specific to their situation before making any financial investment decision.[/I]
FxGrow Daily Technical Analysis – 29th March, 2016
By FxGrow Research & Analysis Team
EURGBP
This analysis is a continuation of previous one, published on Thursday 24th of March. Since then, EUR/GBP has failed in getting through the last high resistance and corrected a bit. Of course, since last Thursday we had weekend and Easter which froze the market, but during Monday session EUR/GBP touched first demand zone and it does it twice.
To read this Full in depth Analysis please visit FxGrow.
Note: This analysis is intended to provide general information and does not constitute the provision of INVESTMENT ADVICE. Investors should, before acting on this information, consider the appropriateness of this information having regard to their personal objectives, financial situation or needs. We recommend investors obtain investment advice specific to their situation before making any financial investment decision.
[B]FxGrow Daily Technical Analysis – 29th March, 2016[/B]
[I]By FxGrow Research & Analysis Team[/I]
[B]Crude oil tests the price gap[/B]
On the daily chart of May contracts for crude oil, we can see that price once again tested the support area defined by weekend price gap sketched between March 4-7 (ranging over 1.5USD). Declines reached the above mentioned zone after a failed test of resistance level which is determined thanks to the October 2015 lows (42.58).
[B][I]To read this Full in depth Analysis please visit FxGrow.[/I][/B]
[I][B]Note:[/B] This analysis is intended to provide general information and does not constitute the provision of INVESTMENT ADVICE. Investors should, before acting on this information, consider the appropriateness of this information having regard to their personal objectives, financial situation or needs. We recommend investors obtain investment advice specific to their situation before making any financial investment decision.[/I]
[B]FxGrow Daily Technical Analysis – 30th March, 2016[/B]
[I]By FxGrow Research & Analysis Team[/I]
[B]EURUSD - the test of March’s high[/B]
After side trend in which EURUSD moved for a few days (just above 1.1160 level), finally new upward wave occurred. Yesterday first resistance at 1.1200 was broken and a direct cause of larger volatility was yesterday’s public speech of Janet Yellen. Chair of the FED indicated anxiety of the low inflation and she said that Federal Reserve has tools to fight with this problem. This could mean a significant extension of the period of low interest rates in the US.
[B][I]To read this Full in depth Analysis please visit FxGrow.[/I][/B]
[I][B]Note:[/B] This analysis is intended to provide general information and does not constitute the provision of INVESTMENT ADVICE. Investors should, before acting on this information, consider the appropriateness of this information having regard to their personal objectives, financial situation or needs. We recommend investors obtain investment advice specific to their situation before making any financial investment decision.[/I]
[B]FxGrow Daily Technical Analysis – 30th March, 2016[/B]
[I]By FxGrow Research & Analysis Team[/I]
[B]GBPUSD - above resistance 1.4400[/B]
After last week’s selloff at GBPUSD which started after terrorist attacks in Brussels, declines reached support at 1.4070. Declines were finished last Thursday after local double bottom pattern and bullish candle (at time-frame H4) with long lower shadow. Demand took over control during end of last week but current week it was a capitulation of supply.
[B][I]To read this Full in depth Analysis please visit FxGrow.[/I][/B]
[I][B]Note:[/B] This analysis is intended to provide general information and does not constitute the provision of INVESTMENT ADVICE. Investors should, before acting on this information, consider the appropriateness of this information having regard to their personal objectives, financial situation or needs. We recommend investors obtain investment advice specific to their situation before making any financial investment decision.[/I]
[B]FxGrow Daily Technical Analysis – 31st March, 2016[/B]
[I]By FxGrow Research & Analysis Team[/I]
[B]NZDCAD - long PIN BAR candle at the resistance[/B]
Yesterday on NZDCAD interesting daily candle occurred. Demand was punished for too rapid attempt of rebound and on the chart PIN BAR candle occurred with a long upper shadow. Shadow of that candle tested resistance at 0.9050.
[B][I]To read this Full in depth Analysis please visit FxGrow.[/I][/B]
[I][B]Note:[/B] This analysis is intended to provide general information and does not constitute the provision of INVESTMENT ADVICE. Investors should, before acting on this information, consider the appropriateness of this information having regard to their personal objectives, financial situation or needs. We recommend investors obtain investment advice specific to their situation before making any financial investment decision.[/I]
[B]FxGrow Daily Technical Analysis – 04th April, 2016[/B]
[I]By FxGrow Research & Analysis Team[/I]
[B]USDCAD back to touch highs as it underpinned long-term support[/B]
The USDCAD decreased for nine consecutive weeks as the pair hits fresh 2016 lows near 1.2857. This long-term support level provides signals of a reversal trend as the USDCAD touched 1.2832 lows in October 2015. Thus prices are expected to comeback as the pair breaks 1.3075 reaching 1.3090 and 1.3125 respectively.
[B][I]To read this Full in depth Analysis please visit FxGrow.[/I][/B]
[I][B]Note:[/B] This analysis is intended to provide general information and does not constitute the provision of INVESTMENT ADVICE. Investors should, before acting on this information, consider the appropriateness of this information having regard to their personal objectives, financial situation or needs. We recommend investors obtain investment advice specific to their situation before making any financial investment decision.[/I]
[B]FxGrow Daily Technical Analysis – 04th April, 2016[/B]
[I]By FxGrow Research & Analysis Team[/I]
[B]EURUSD further upside direction[/B]
The EURUSD started pushing higher after Yellen’s comments last week. The EURUSD is attempting to have a bullish breakout after an increase in US unemployment rate producing a slack in US labor market especially as the price cuts 1.1400 as a strong resistance. Thus next resistances are located at 1.1440 and 1.1470.
[B][I]To read this Full in depth Analysis please visit FxGrow.[/I][/B]
[I][B]Note:[/B] This analysis is intended to provide general information and does not constitute the provision of INVESTMENT ADVICE. Investors should, before acting on this information, consider the appropriateness of this information having regard to their personal objectives, financial situation or needs. We recommend investors obtain investment advice specific to their situation before making any financial investment decision.[/I]
[B]FxGrow Daily Technical Analysis – 05th April, 2016[/B]
[I]By FxGrow Research & Analysis Team[/I]
[B]AUDUSD rallied as RBA kept lending rate steady[/B]
The AUDUSD traded higher as the Reserve Bank of Australia (RBA) weakens rate cut expectations and kept lending rate unchanged at 2%. Breaking 0.7640 increases to 0.7675 as a major resistance level and cutting this point will produce a bullish momentum targeting 0.7723 and 0.7745 respectively.
[B][I]To read this Full in depth Analysis please visit FxGrow.[/I][/B]
[I][B]Note:[/B] This analysis is intended to provide general information and does not constitute the provision of INVESTMENT ADVICE. Investors should, before acting on this information, consider the appropriateness of this information having regard to their personal objectives, financial situation or needs. We recommend investors obtain investment advice specific to their situation before making any financial investment decision.[/I]
[B]FxGrow Daily Technical Analysis – 05th April, 2016[/B]
[I]By FxGrow Research & Analysis Team[/I]
[B]EURUSD overbought territory might lead to strong pullback[/B]
The EURUSD failed to continue gaining after reaching 1.1437 high this year. Hitting higher lows and failing to cut 1.1420 and the European Central Bank (ECB) dovish outlook for inflation and monetary policy give signs of a strong pullback and will open the door of a downside move. Cutting 1.1365 as a strong point will push the EURUSD lower toward 1.1345, 1.1325 and 1.1295 as next support levels.
[B][I]To read this Full in depth Analysis please visit FxGrow.[/I][/B]
[I][B]Note:[/B] This analysis is intended to provide general information and does not constitute the provision of INVESTMENT ADVICE. Investors should, before acting on this information, consider the appropriateness of this information having regard to their personal objectives, financial situation or needs. We recommend investors obtain investment advice specific to their situation before making any financial investment decision.[/I]
[B]FxGrow Daily Technical Analysis – 06th April, 2016[/B]
[I]By FxGrow Research & Analysis Team[/I]
[B]USDJPY rise as risk appetite firms in Asia[/B]
USDJPY fell to 14 month lows at 109.95 yesterday on BOJ negative interest rate policy. Japanese Yen gains support as Kuroda said that he will keep monitoring the currency and warned of further interest rate cut. Breaking 1.1015 as a minor support point will nourish the downside trend and will push the USDJPY lower toward 109.95, 109.70 and 109.50 respectively.
[B][I]To read this Full in depth Analysis please visit FxGrow.[/I][/B]
[I][B]Note:[/B] This analysis is intended to provide general information and does not constitute the provision of INVESTMENT ADVICE. Investors should, before acting on this information, consider the appropriateness of this information having regard to their personal objectives, financial situation or needs. We recommend investors obtain investment advice specific to their situation before making any financial investment decision.[/I]
[B]FxGrow Daily Technical Analysis – 06th April, 2016[/B]
[I]By FxGrow Research & Analysis Team[/I]
[B]GBPUSD is in a chaotic position on ‘BREXIT’ risk [/B]
GBPUSD is extending its weakness as ‘Brexit’ is creating volatility as it gets priced in. The BOE financial policy committee increased the countercyclical capital buffer rate for UK exposures from 0% to 0.5% and raises risks of the UK economy as more possibilities of the EU referendum ‘Brexit’ emerge.
[B][I]To read this Full in depth Analysis please visit FxGrow.[/I][/B]
[I][B]Note:[/B] This analysis is intended to provide general information and does not constitute the provision of INVESTMENT ADVICE. Investors should, before acting on this information, consider the appropriateness of this information having regard to their personal objectives, financial situation or needs. We recommend investors obtain investment advice specific to their situation before making any financial investment decision.[/I]
[B]FxGrow Daily Technical Analysis – 07th April, 2016[/B]
[I]By FxGrow Research & Analysis Team[/I]
[B]EURUSD Bullish breakout ahead of ECB meeting[/B]
The EURUSD entered a bullish trend after it trades above 1.1420 powered by FOMC meeting minute release. Yesterday, a positive sentiment was created as the EURUSD failed to close lower and as the FOMC increased caution for interest rate hike this year pushing the pair higher targeting 1.1455, 1.1480 and 1.1515 as next resistance levels.
[B][I]To read this Full in depth Analysis please visit FxGrow.[/I][/B]
[I][B]Note:[/B] This analysis is intended to provide general information and does not constitute the provision of INVESTMENT ADVICE. Investors should, before acting on this information, consider the appropriateness of this information having regard to their personal objectives, financial situation or needs. We recommend investors obtain investment advice specific to their situation before making any financial investment decision.[/I]
[B]FxGrow Daily Technical Analysis – 07th April, 2016[/B]
[I]By FxGrow Research & Analysis Team[/I]
[B]USDCAD stalled gains after weak IVEY PMI data[/B]
The USDCAD failed to gain traction above 1.3220 resistance point forming a strong downtrend after weaker than expected PMI data. Yesterday’s FOMC meeting minute released supported the downward direction of the trend as the USDCAD closed below the major resistance level 1.3100. Breaking 1.3030 will ruin the pair reaching 1.3000, 1.2965 and 1.2940.
[B][I]To read this Full in depth Analysis please visit FxGrow.[/I][/B]
[I][B]Note:[/B] This analysis is intended to provide general information and does not constitute the provision of INVESTMENT ADVICE. Investors should, before acting on this information, consider the appropriateness of this information having regard to their personal objectives, financial situation or needs. We recommend investors obtain investment advice specific to their situation before making any financial investment decision.[/I]
[B]FxGrow Daily Technical Analysis – 08th April, 2016[/B]
[I]By FxGrow Research & Analysis Team[/I]
[B]EURUSD struggled after Yellen’s comments[/B]
The EURUSD failed to breakout and continue its uptrend after reaching 1.1455 high on Yellen’s less cautious tone for interest rate hike this year. Japanese finance minister also supported the dollar on warnings of the one-sided Yen rise. Breaking the strong support point 1.1360 will push the EURUSD lower reaching next support levels 1.1325 and 1.1295.
[B][I]To read this Full in depth Analysis please visit FxGrow.[/I][/B]
[I][B]Note:[/B] This analysis is intended to provide general information and does not constitute the provision of INVESTMENT ADVICE. Investors should, before acting on this information, consider the appropriateness of this information having regard to their personal objectives, financial situation or needs. We recommend investors obtain investment advice specific to their situation before making any financial investment decision.[/I]
[B]FxGrow Daily Technical Analysis – 11th April, 2016[/B]
[I]By FxGrow Research & Analysis Team[/I]
[B]EURUSD more actions on ECB minutes[/B]
The EURUSD steadied in a long-term range between 1.1365 and 1.1435 on political tension and ‘Brexit’ issues and on concerns that the ECB is more likely to cut further rates than expanding Quantitative Easing (QE) program. The EURUSD remains under pressure as it fails to cut 1.1455 and breaking 1.1390 will continue slumping near 1.1375, 1.1345 and 1.1330 respectively.
[B][I]To read this Full in depth Analysis please visit FxGrow.[/I][/B]
[I][B]Note:[/B] This analysis is intended to provide general information and does not constitute the provision of INVESTMENT ADVICE. Investors should, before acting on this information, consider the appropriateness of this information having regard to their personal objectives, financial situation or needs. We recommend investors obtain investment advice specific to their situation before making any financial investment decision.[/I]
[B]FxGrow Daily Technical Analysis – 11th April, 2016[/B]
[I]By FxGrow Research & Analysis Team[/I]
[B]GBPUSD trade sentiment stays above the long-term support ahead of BOE meeting[/B]
GBPUSD has appreciated and traded above 1.4060 after Fed dovish comments on interest rate hike expectations this year. Sticky UK inflation will push the GBPUSD higher and cutting 1.4190 continues increasing to 1.4220, 1.4245 and 1.4265 as next resistance levels.
[B][I]To read this Full in depth Analysis please visit FxGrow.[/I][/B]
[I][B]Note:[/B] This analysis is intended to provide general information and does not constitute the provision of INVESTMENT ADVICE. Investors should, before acting on this information, consider the appropriateness of this information having regard to their personal objectives, financial situation or needs. We recommend investors obtain investment advice specific to their situation before making any financial investment decision.[/I]
[B]FxGrow Daily Technical Analysis – 12th April, 2016[/B]
[I]By FxGrow Research & Analysis Team[/I]
[B]EURUSD Bearish signal among negative RSI[/B]
The EURUSD remains consolidating in a long-term range below the highest level 1.1455 this year. The pace of Fed interest rate hike weighed on the EURUSD as Fed policymakers calls for a June rate hike. Breaking the 61.8% Fibonacci expansion 1.1365 will confirm a bearish reversal toward 1.1335, 1.1295 and 1.1265 respectively.
[B][I]To read this Full in depth Analysis please visit FxGrow.[/I][/B]
[I][B]Note:[/B] This analysis is intended to provide general information and does not constitute the provision of INVESTMENT ADVICE. Investors should, before acting on this information, consider the appropriateness of this information having regard to their personal objectives, financial situation or needs. We recommend investors obtain investment advice specific to their situation before making any financial investment decision.[/I]