FxGrow Daily Technical Analysis – 21st June, 2016
By FxGrow Research & Analysis Team
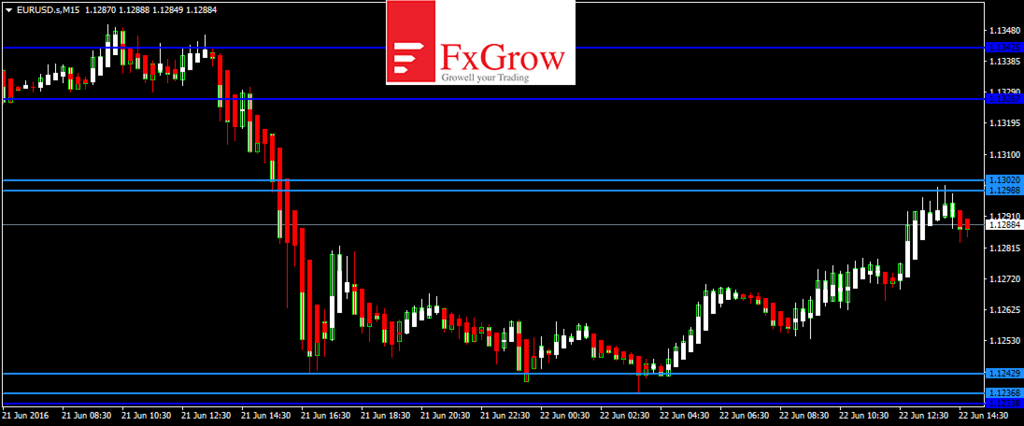
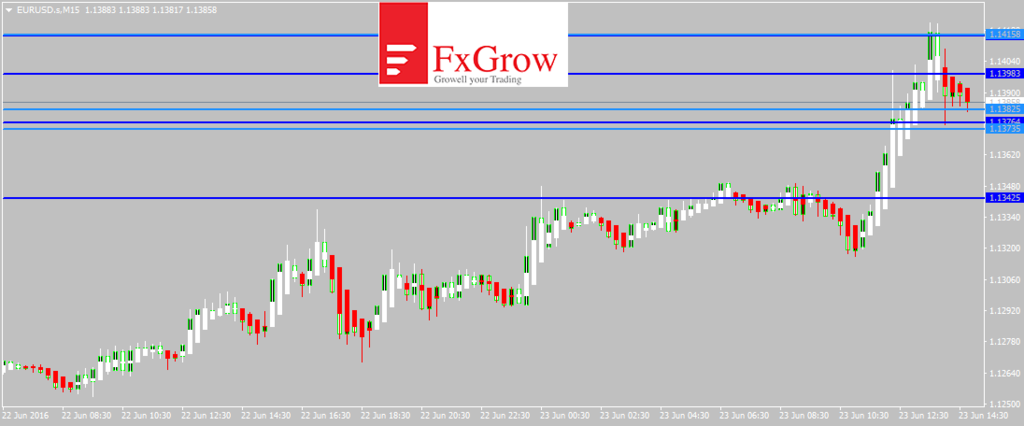
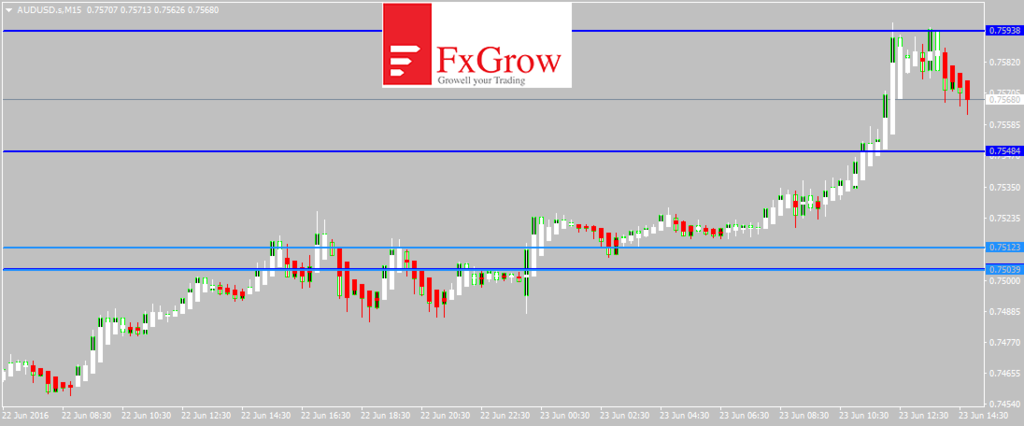
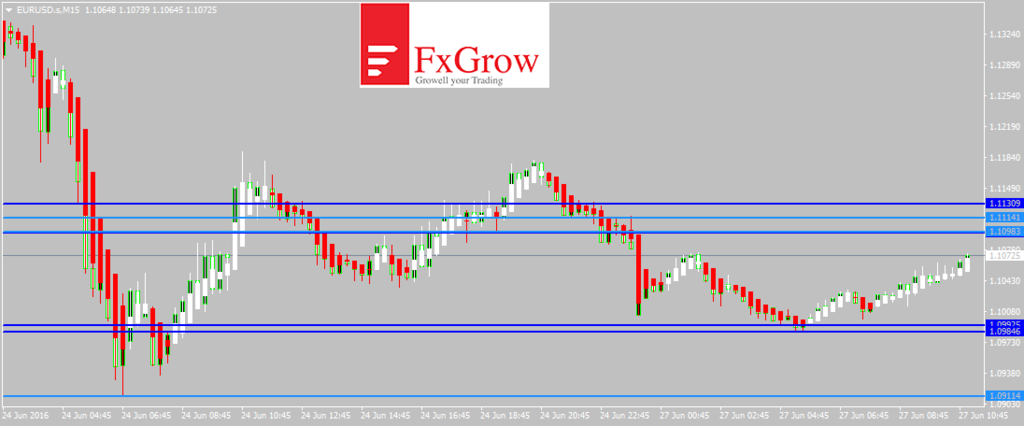
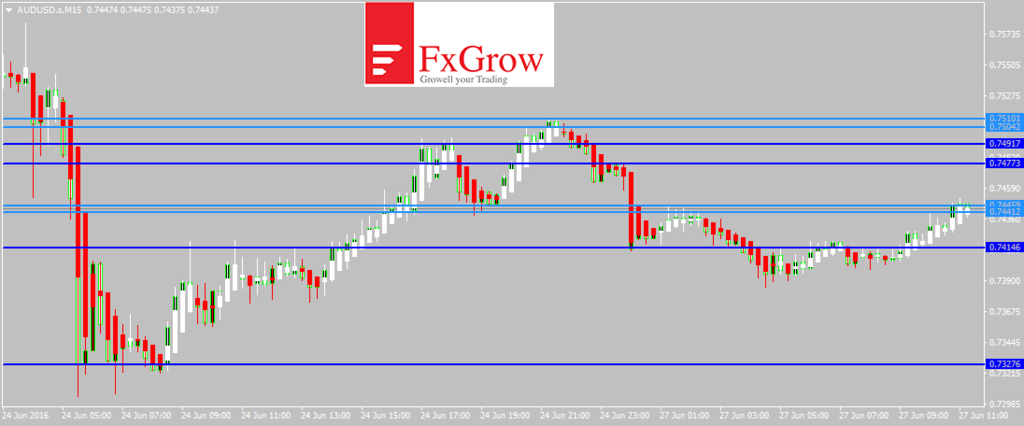
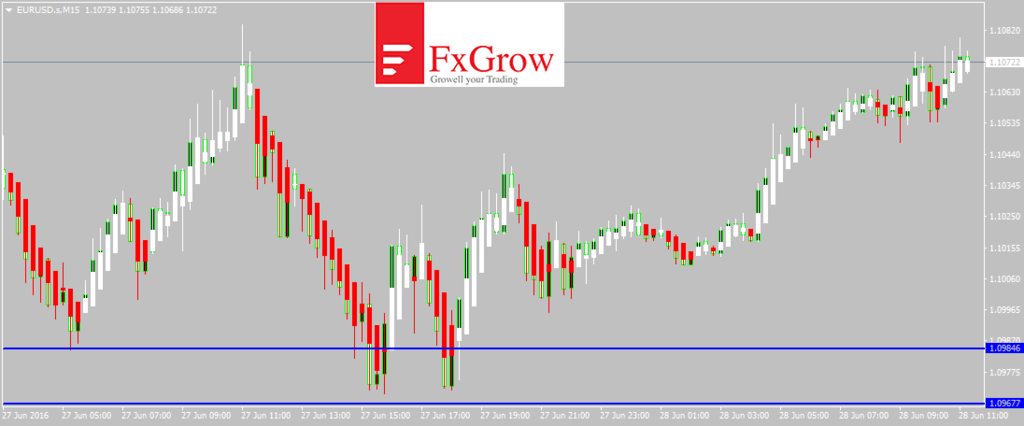
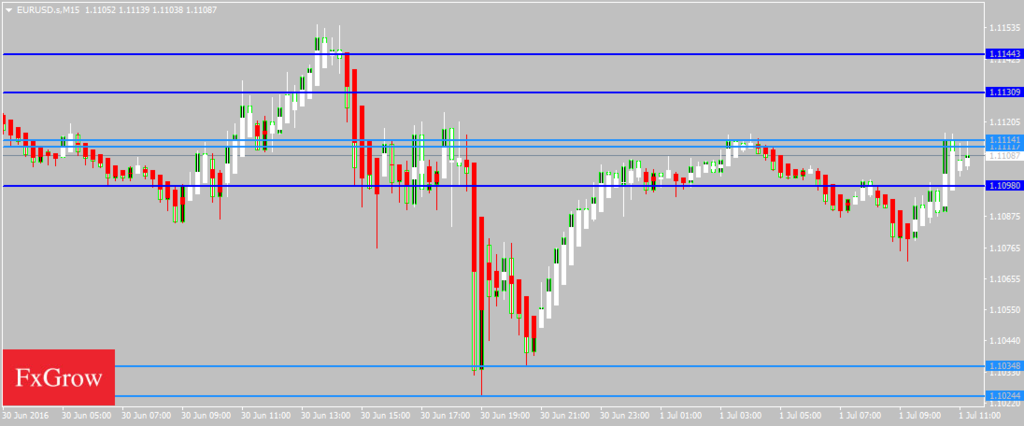
EURUSD
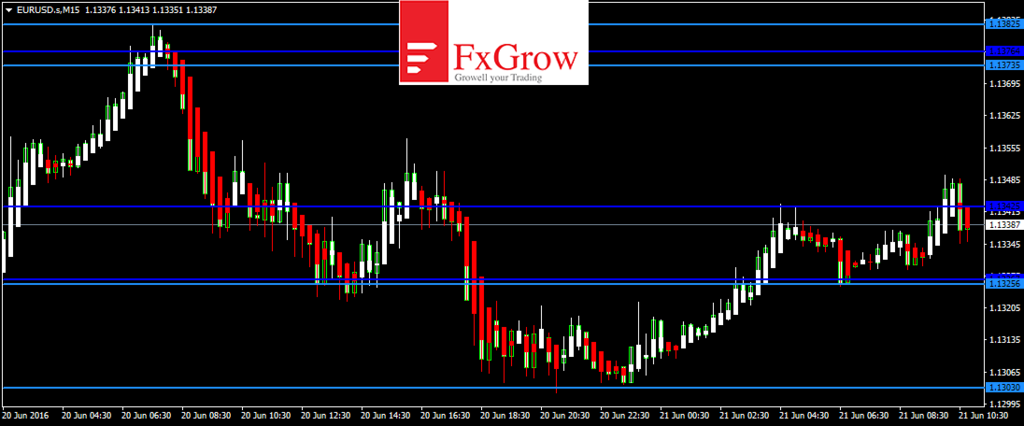
EURUSD had a slight bearish correction yesterday and is now trading in a bullish tone crossing 1.1340 in the Asian trading session. The pair is trading above its 100day SMA of 1.1275; the near term bias is Bullish with targets of 1.1350
RSI (14), STOCH (9, 6), MACD (12, 26), ADX (14), CCI (14) indicate a BUY; STOCHRSI (14) is Overbought while Average True Range (14) indicates Less Volatility.
Support is at 1.1303 while Resistance is at 1.1376 and 1.1382
21st June 2016 – 08:05hrs GMT
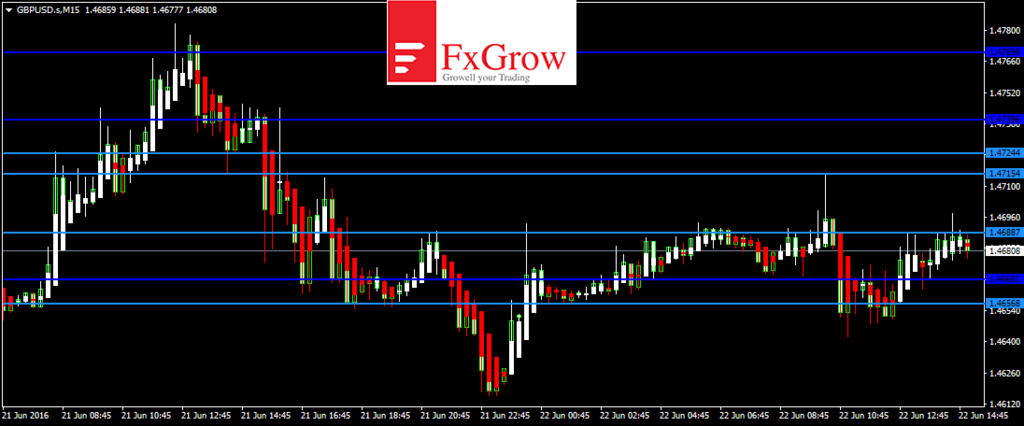
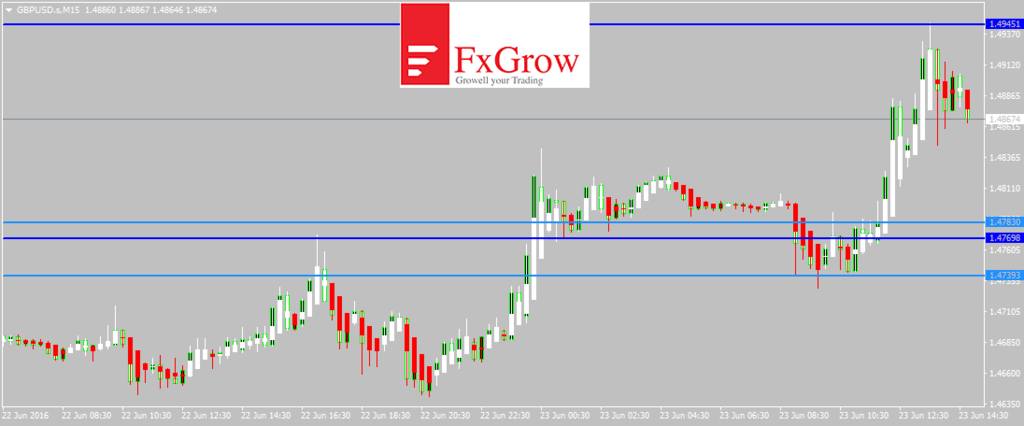
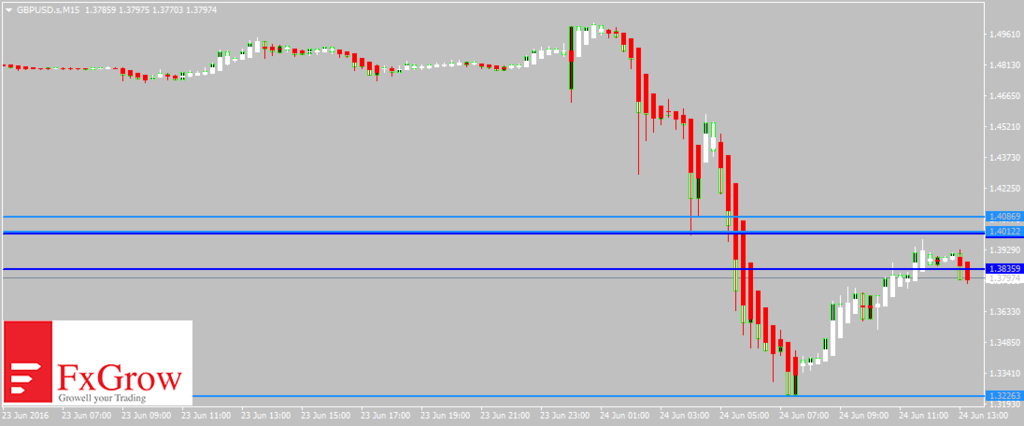
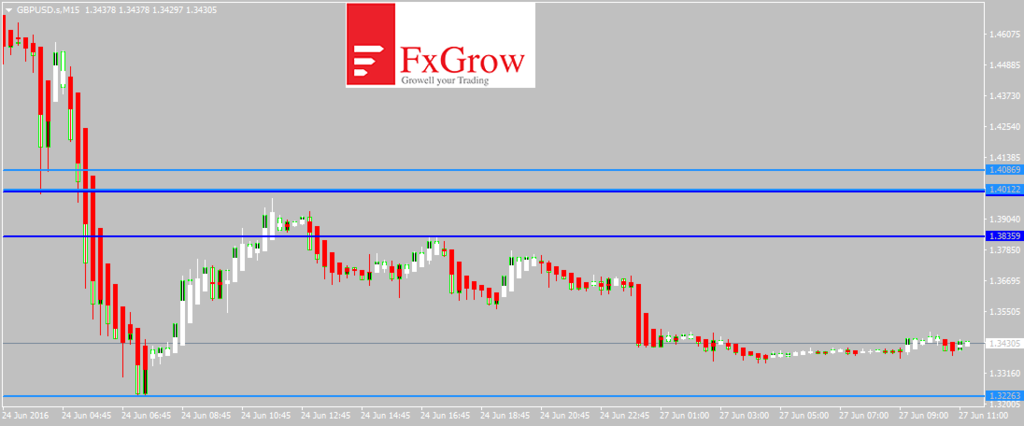
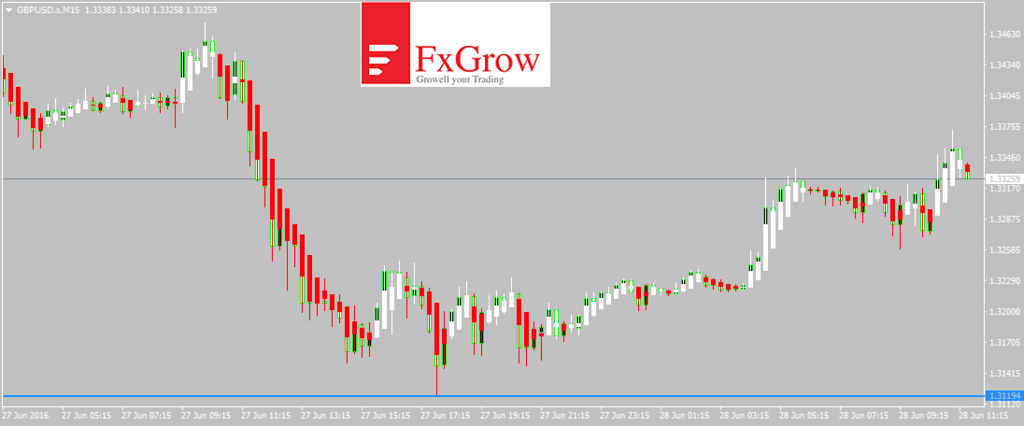
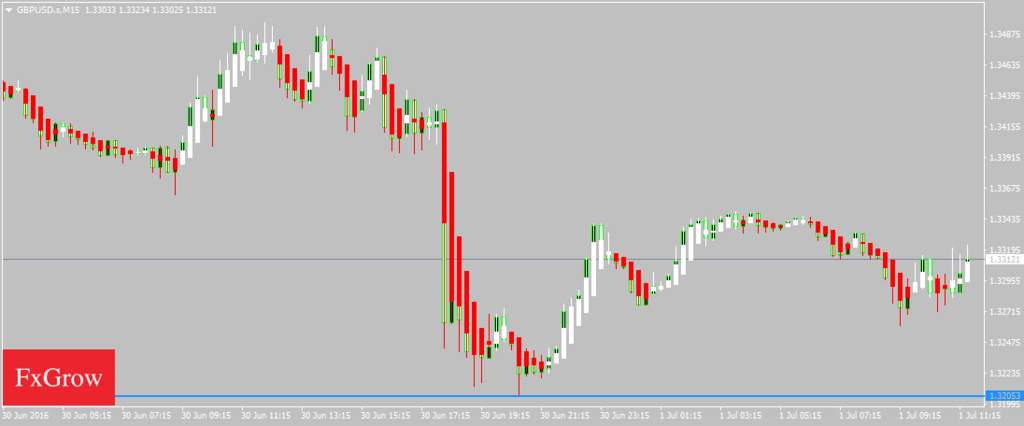
GBPUSD
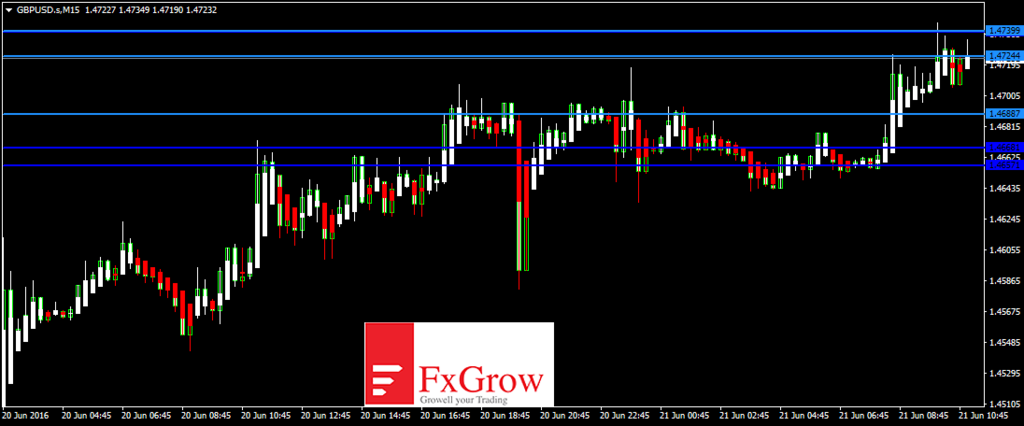
GBPUSD continued its strong bullish overtone yesterday and is now trading above the 1.4700 handle in the Asian trading session. Some downside correction is expected in the European trading session. The near term bias is Neutral to Bullish with targets of 1.4750
RSI (14), STOCHRSI (14), MACD (12, 26), ADX (14), CCI (14), ROC indicate a BUY; STOCH (9, 6) is Neutral while Average True Range (14) indicates Less Volatility.
Support is at 1.4657 while Resistance is at 1.4739
21st June 2016 – 08:15hrs GMT
For more in depth Research & Analysis please visit FxGrow.
Note: This analysis is intended to provide general information and does not constitute the provision of INVESTMENT ADVICE. Investors should, before acting on this information, consider the appropriateness of this information having regard to their personal objectives, financial situation or needs. We recommend investors obtain investment advice specific to their situation before making any financial investment decision.