Daily Technical Analysis – 13th Aug, 2015
By FxGrow Research & Analysis Team
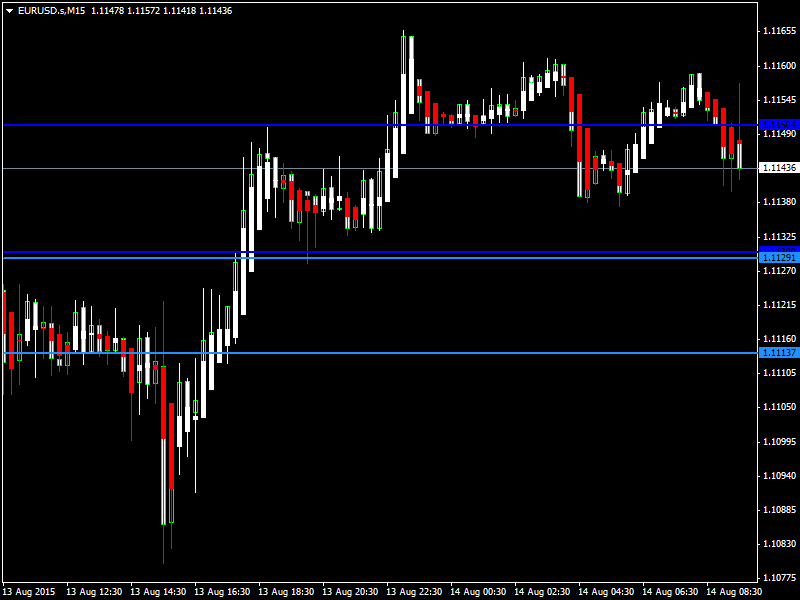
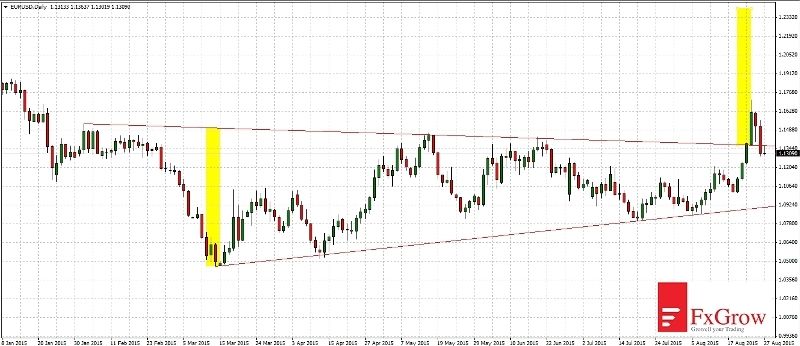
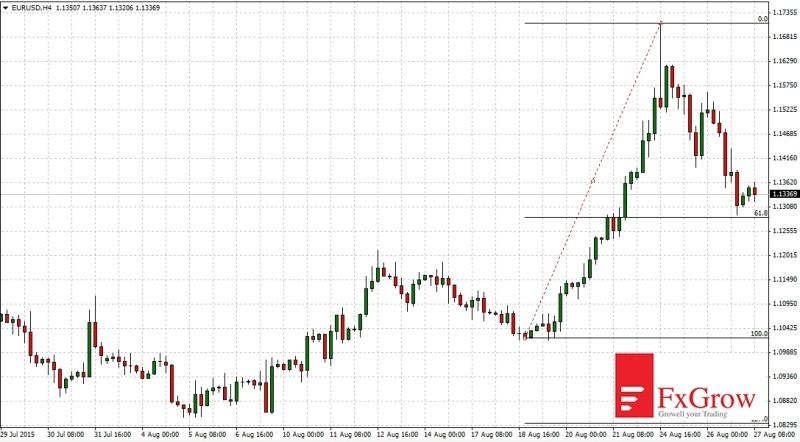
EURUSD
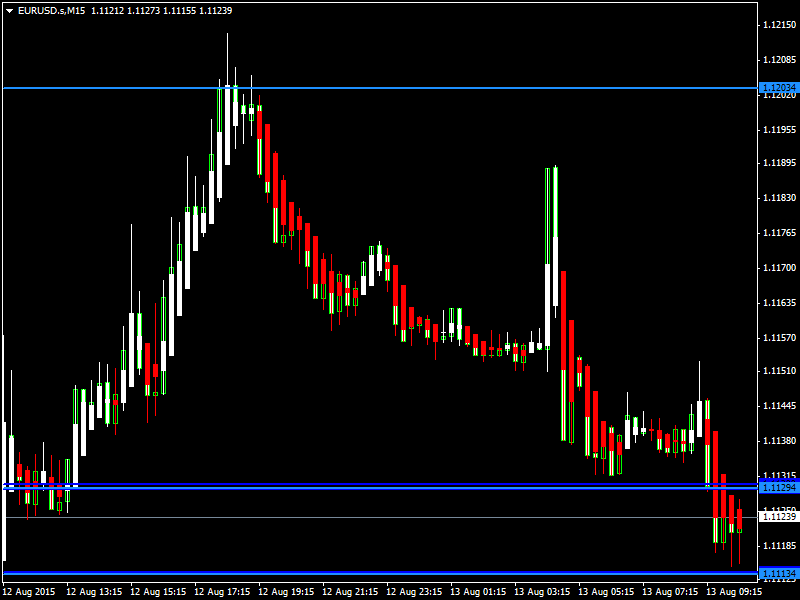
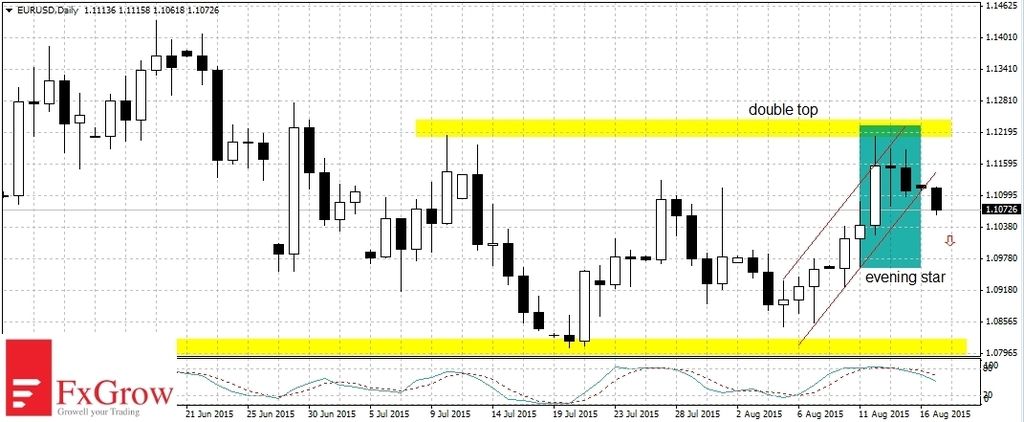
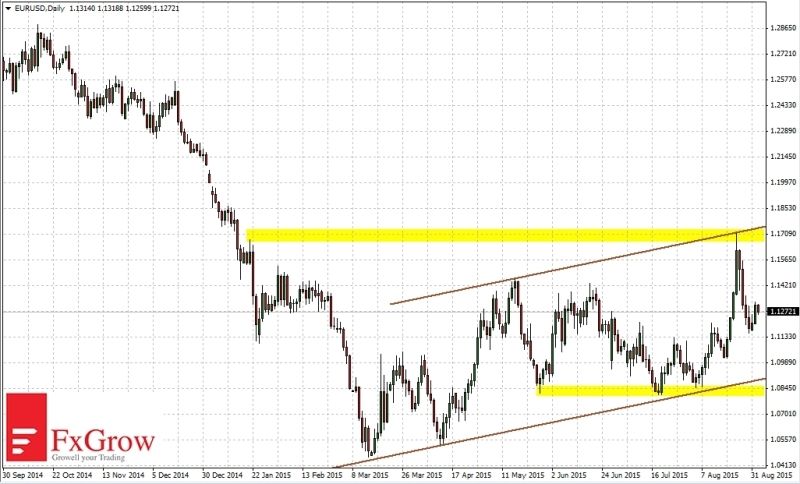
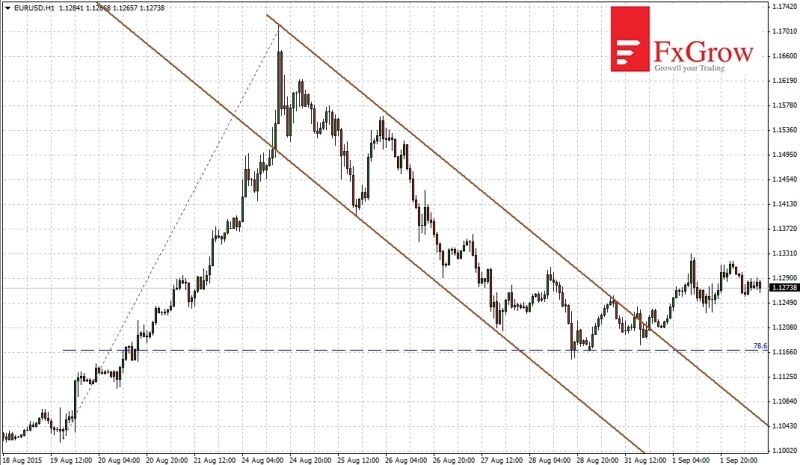
EURUSD was bullish yesterday as it touched a high of 1.1212 yesterday but came down towards the end of the trading session. Now the pair is trading below its 20day moving average of 1.1156 in the European trading session. The near term bias remains Bearish with targets of 1.1080
STOCH (9, 6), ADX (14), CCI (14), Ultimate Oscillator, ROC indicate a SELL; STOCHRSI (14) is Oversold; while Average True Range (14) indicates Less Volatility.
Support is at 1.1078 while Resistance is at 1.1148
13th Aug 2015 – 07:33hrs GMT
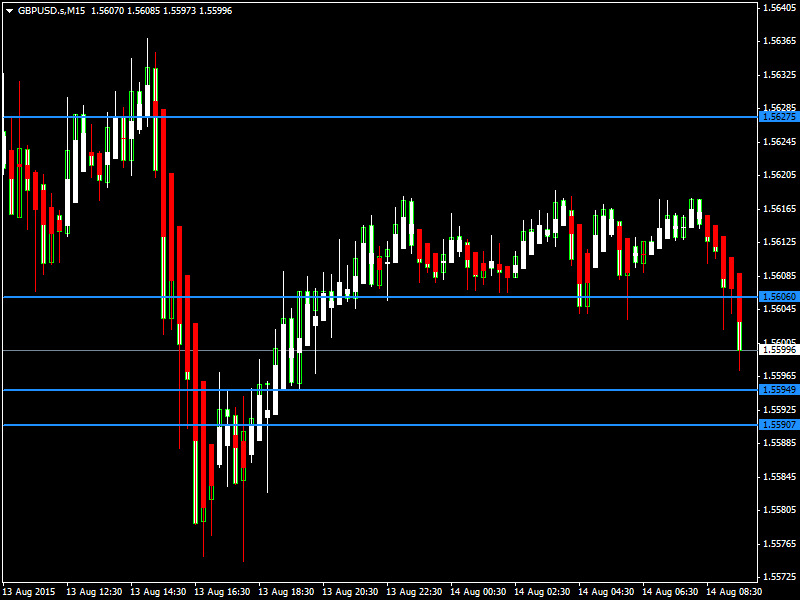
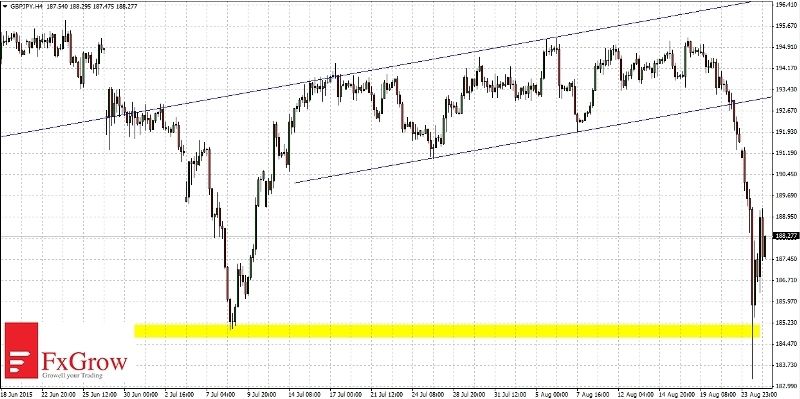
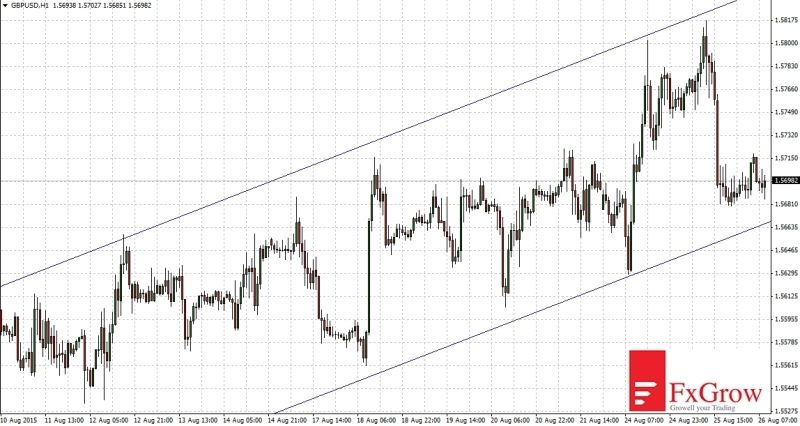
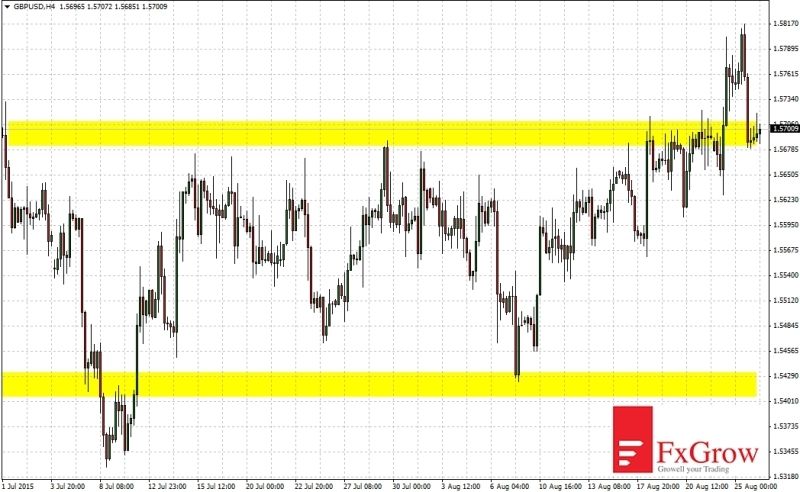
GBPUSD
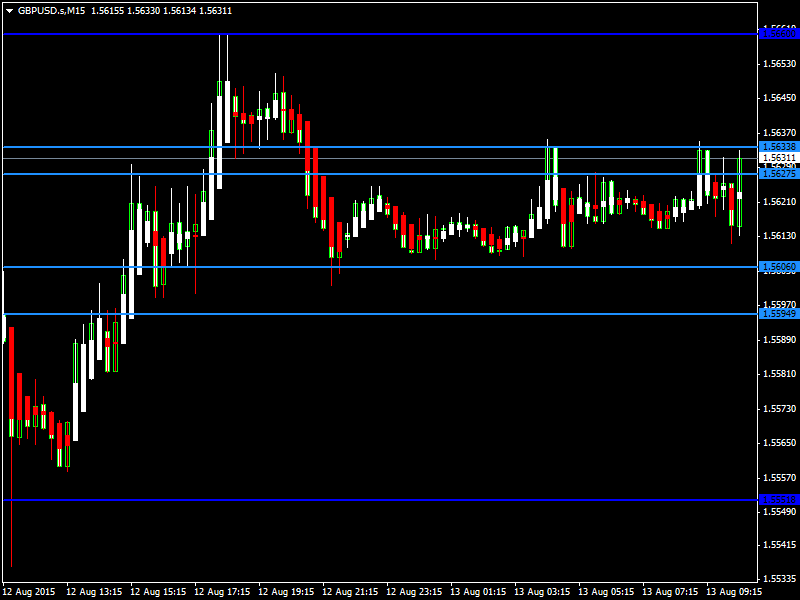
GBPUSD was indecisive yesterday but remained on the higher side towards the end of the trading session. Now the pair is trading above its 20day moving average of 1.5621 in the European trading session. The near term bias remains Bullish with targets of 1.5670
RSI (14), MACD (12, 26), CCI (14), ROC MA100, MA200 indicate a BUY; STOCHRSI (14) is Overbought; while Average True Range (14) indicates Less Volatility.
Support is at 1.5551 while Resistance is at 1.5660
13th Aug 2015 – 07:36hrs GMT
For more in depth Research & Analysis please visit FxGrow.
Note: This analysis is intended to provide general information and does not constitute the provision of INVESTMENT ADVICE. Investors should, before acting on this information, consider the appropriateness of this information having regard to their personal objectives, financial situation or needs. We recommend investors obtain investment advice specific to their situation before making any financial investment decision.