DJUSRE (Dow Jones Real Estate Index) recently broke above 2007 peak and it would be a good time to revisit the article we published back in 2017 about Real Estate Index and highlighted the target area above 2007 peak. We will also cover Proshares Ultra Real Estate ETF today and look at it’s sequence from 2009 low, target area and also how it supports the path in DJUSRE.
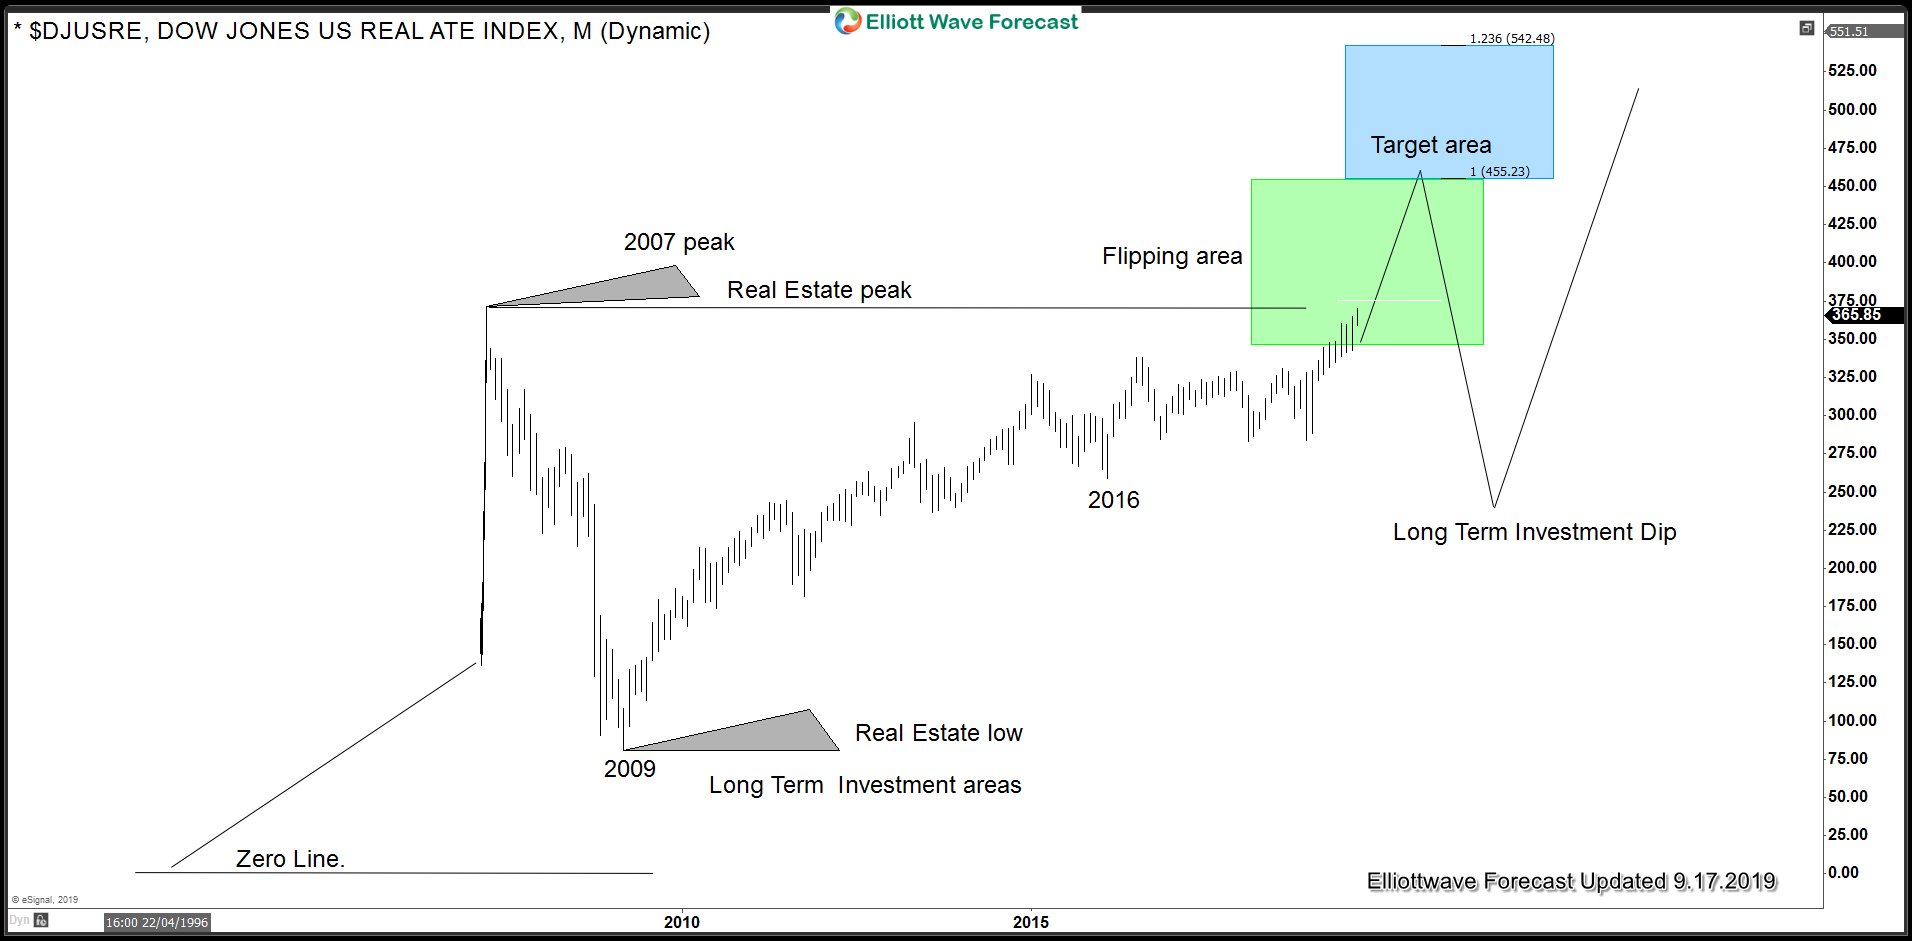
DJUSRE Monthly Chart
Chart below shows Dow Jones Real Estate Index has broken above 2007 peak and focus remains on 455 - 528 area. We expect any dips to remain supported above December 2018 low for more upside towards the blue box area. When buying real estate you can do it for a flip or a long term investment. A flip means that the investor will bet in a fast increase in value and then sell the property for a quick cash. Timing will play a big role when buying for a quick gain as it needs to be done at the proper time. Improper timing can leave investors with a bad investment or like many like to call under the water. As DJUSRE Index has already broken above 2007 level, it could drive properties even to new all-time highs, but investors need to know that if they want to buy now, it is for a quick gain (flip) and not for the long-term Investment. Area between 455 - 542 should result in a much bigger pull back to correct the cycle from 2016 low at least and ideally from 2009 low. Once we do see a correction of at least the 2009 cycle, then we believe we would see the Index back at levels of Long-Term Investments.
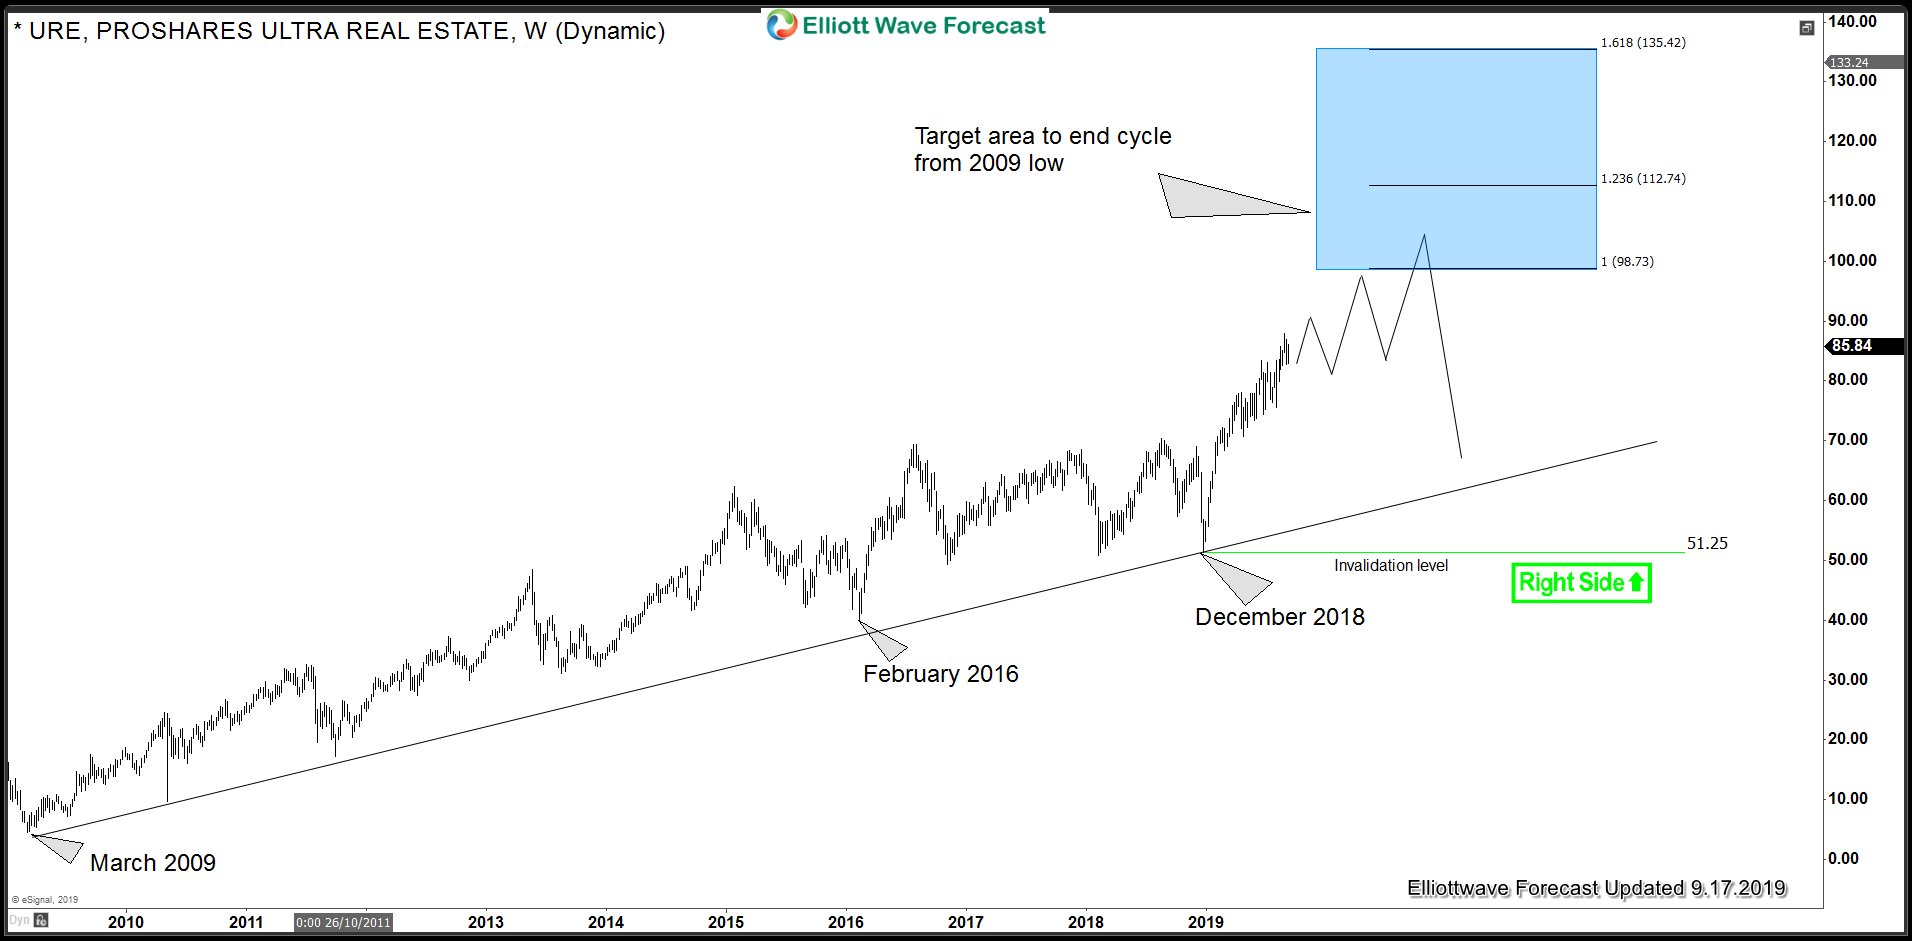
Proshares Ultra Real Estate ETF
Below is the chart of Proshares Ultra Real Estate ETF which is showing an incomplete sequence up from March 2009 low with a target between 98.73 - 112.74 and in extension 135.42. In terms of Elliott wave count, we are either in wave 3 or C up from March 2009 low or we are forming a bullish nest i.e. in wave 1 of (3). In either case, we believe as far as dips hold above December 2018 low, Ultra Real Estate should remain supported in the dips for more upside towards 98.73 - 112.74 area from where a pull back should be seen to correct cycle from February 2016 low or March 2009 low. If rally extends to 135.42, it would become wave 3 before we get a pull back in wave 4 to correct cycle from February 2016 low and higher again.