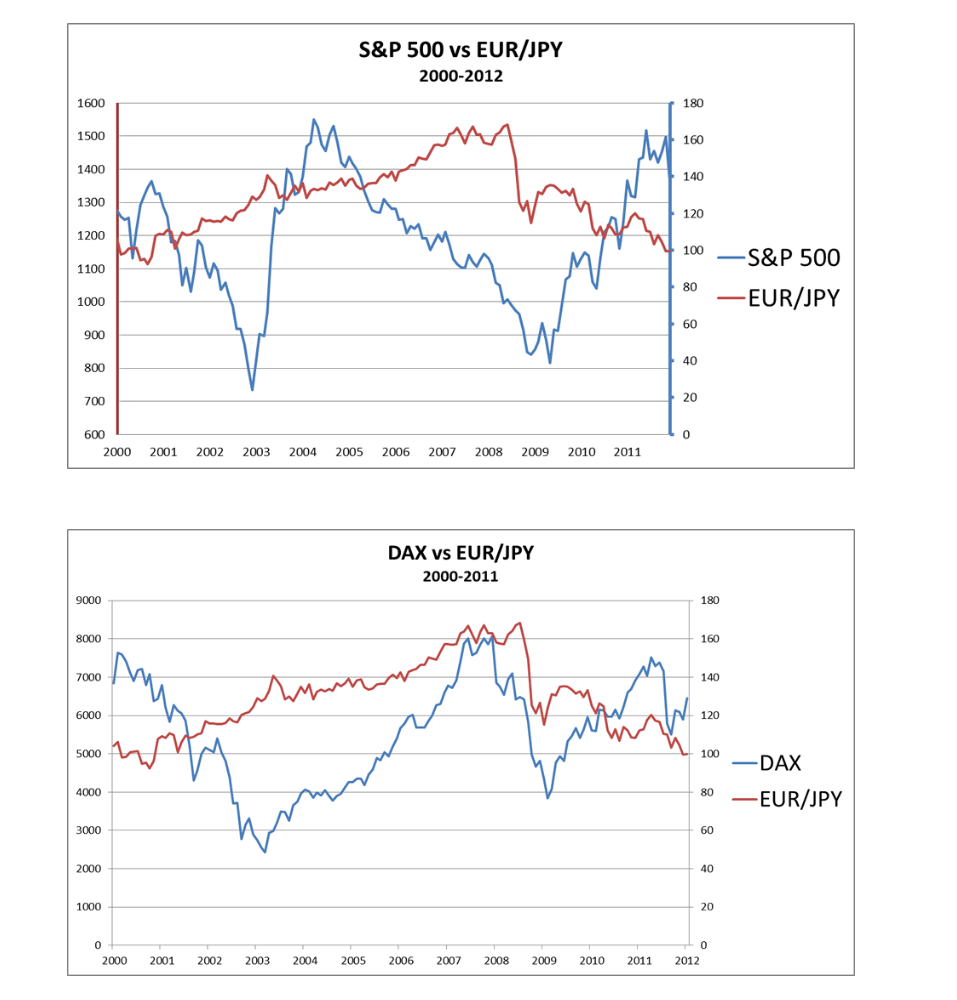
On the BabyPips Forex Training Course, under the “How to Use EUR/JPY as a Leading Indicator for Stocks” Section, do the graphs colors make sense?
The axis label color for EUR/JPY is red but shows it ranges from 600 - 1800 while the label color for S&P500 is blue but ranges from 0 - 180. Also, why are the graphs missing labels colors for DAX vs EUR/JPY?