Elliott Wave View in SPX suggests that the sequence in the index from December 26.2018 low remains incomplete to the upside suggests any dips should remain supported in 3, 7 or 11 swings looking for more upside. Therefore, we don’t prefer selling the index. On the short term chart below, the index is rallying higher in a wave 3 as 5 waves impulsive Elliott Wave structure within the cycle from 10/03/2019 low. Up from there, a rally to $3008.29 high ended wave ((i)) as a lesser degree 5 wave structure. Down from there, a decline to $2976.31 low ended wave ((ii)) pullback in lesser degree 3 swings.
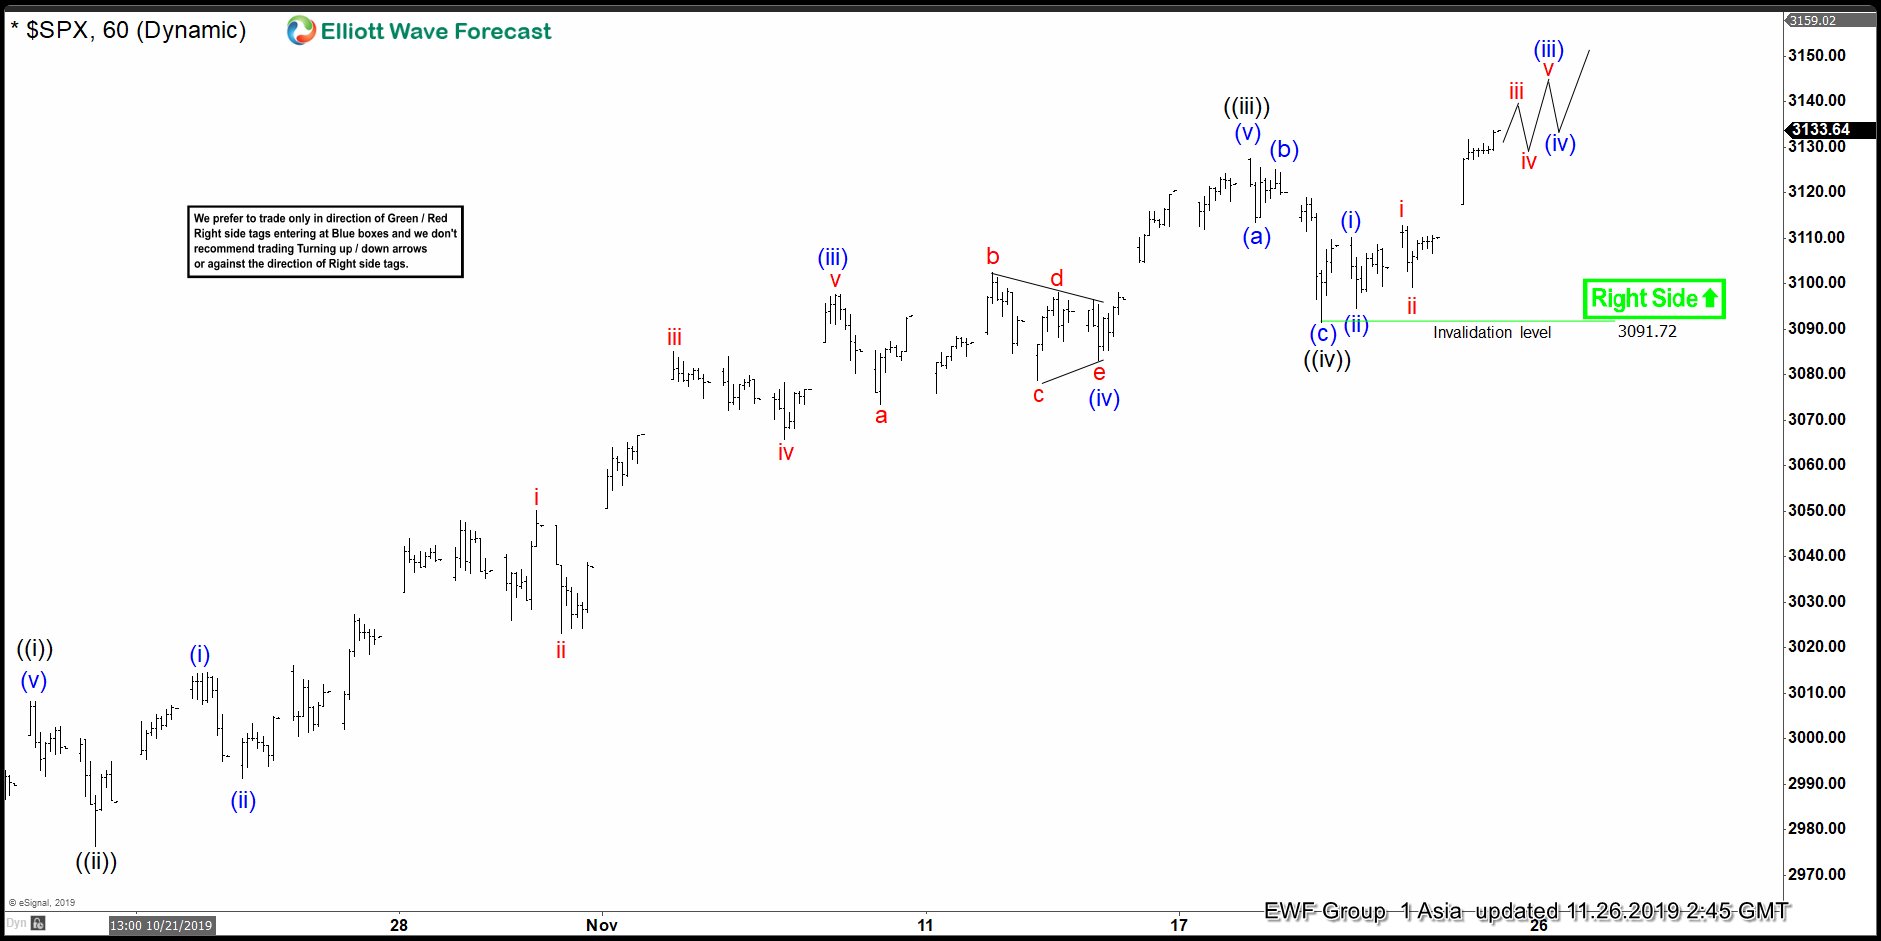
Above from there, wave ((iii)) also unfolded as 5 waves impulse structure where lesser degree wave (i) ended at $3014.57 high. Wave (ii) ended at $2991.21 low, wave (iii) ended at $3097.70 high, wave (iv) ended at $3083.26 low and wave (v) ended at $3127.64 high. While wave ((iv)) pullback unfolded as a lesser degree flat structure where wave (a) ended at $3113.47 low. Wave (b) ended at $3125.16 high and wave © ended at $3091.72 low. Up from there, wave ((v)) remains in progress looking to extend higher towards minimum extension target i.e inverse 1.236%-161.8% Fibonacci extension area of wave ((iv)) which comes at $3138.92-$3153.86 area to the upside before a pullback in wave 4 could take place. Near-term, while dips remain above $3091.72 low expect index to extend higher.
SPX 1 Hour Elliott Wave Chart