Google (ticker: GOOGL) rallies today and should remain supported against the lows on August 2019. The stock is extending within the Super cycle degree wave (III) since the low in 2009. The following chart below shows the current monthly Elliott Wave outlook:
Google Monthly Elliott Wave Chart
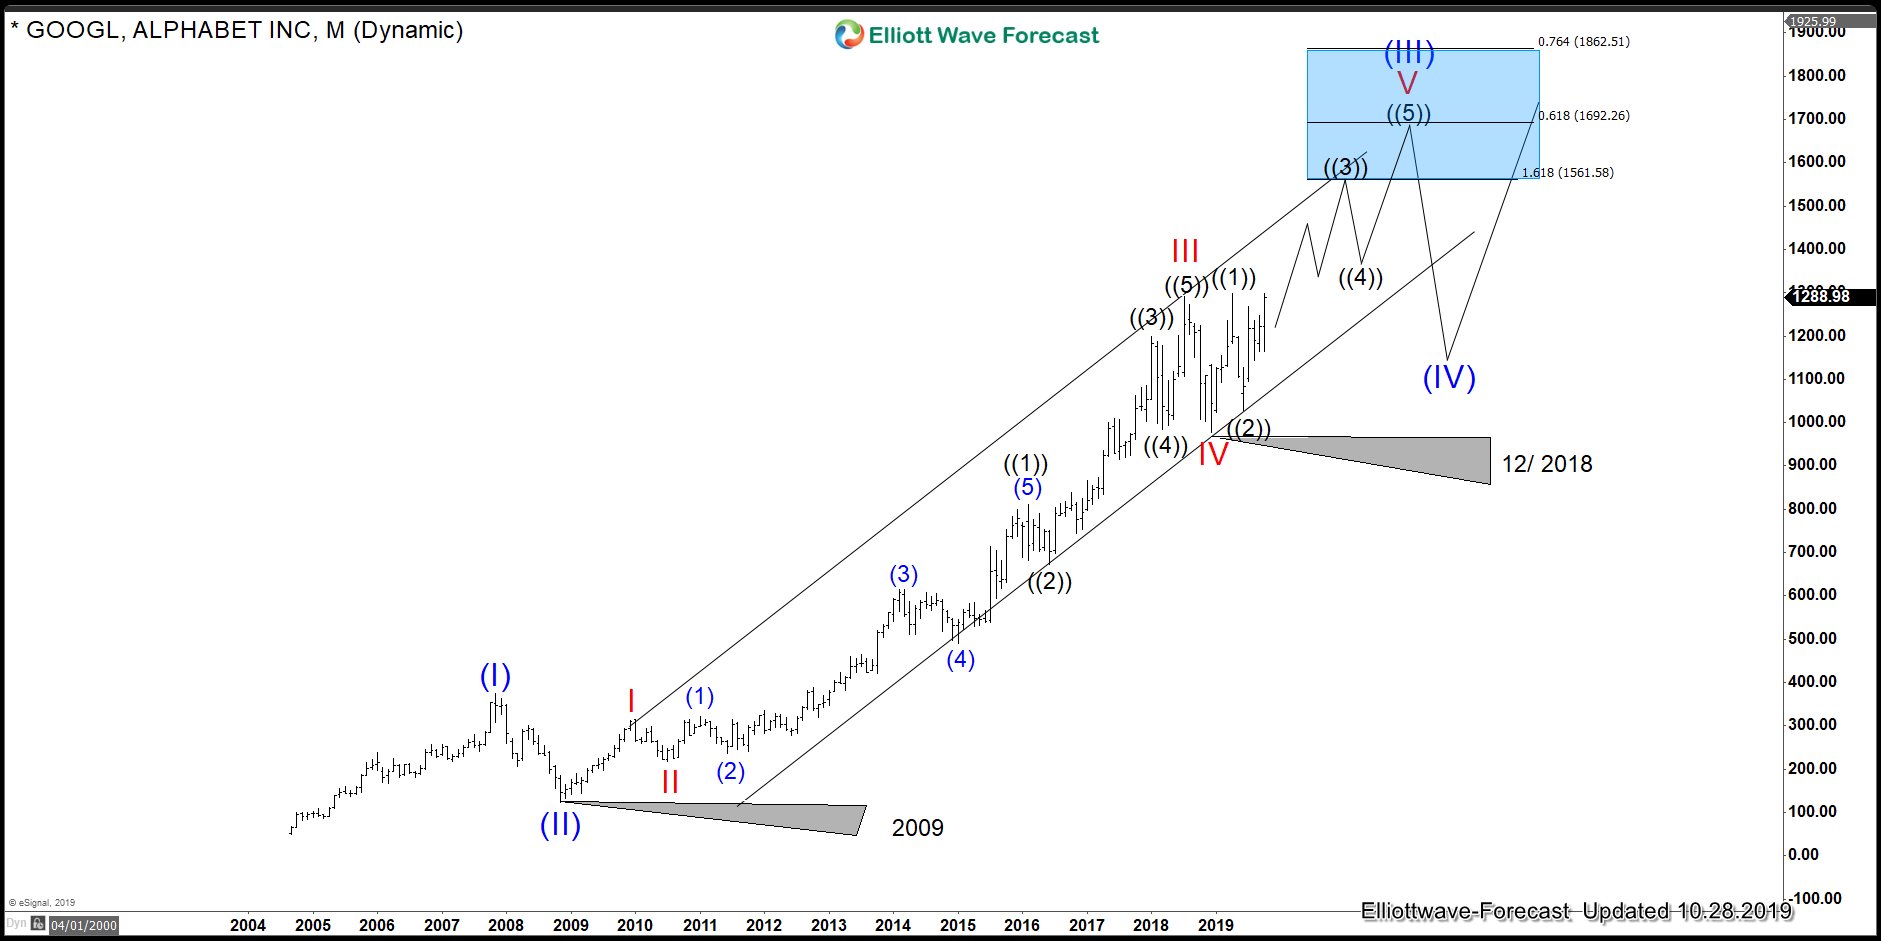
The rally from 2009 low is unfolding as 5 waves impulsive Elliott Wave structure. The bullish and extended 5 waves structure does not only appear in Google, but it also appears in other major Indices around the world. Elliottwave-Forecast we believe in the market correlation and One Market concept, We always say that Elliott Wave Theory by itself is not enough, so we have developed other tools to make it better. Market correlation and one market concept allow us to forecast an instrument within the same category which may not look very clear if only looking at it without reference to other correlated instrument.
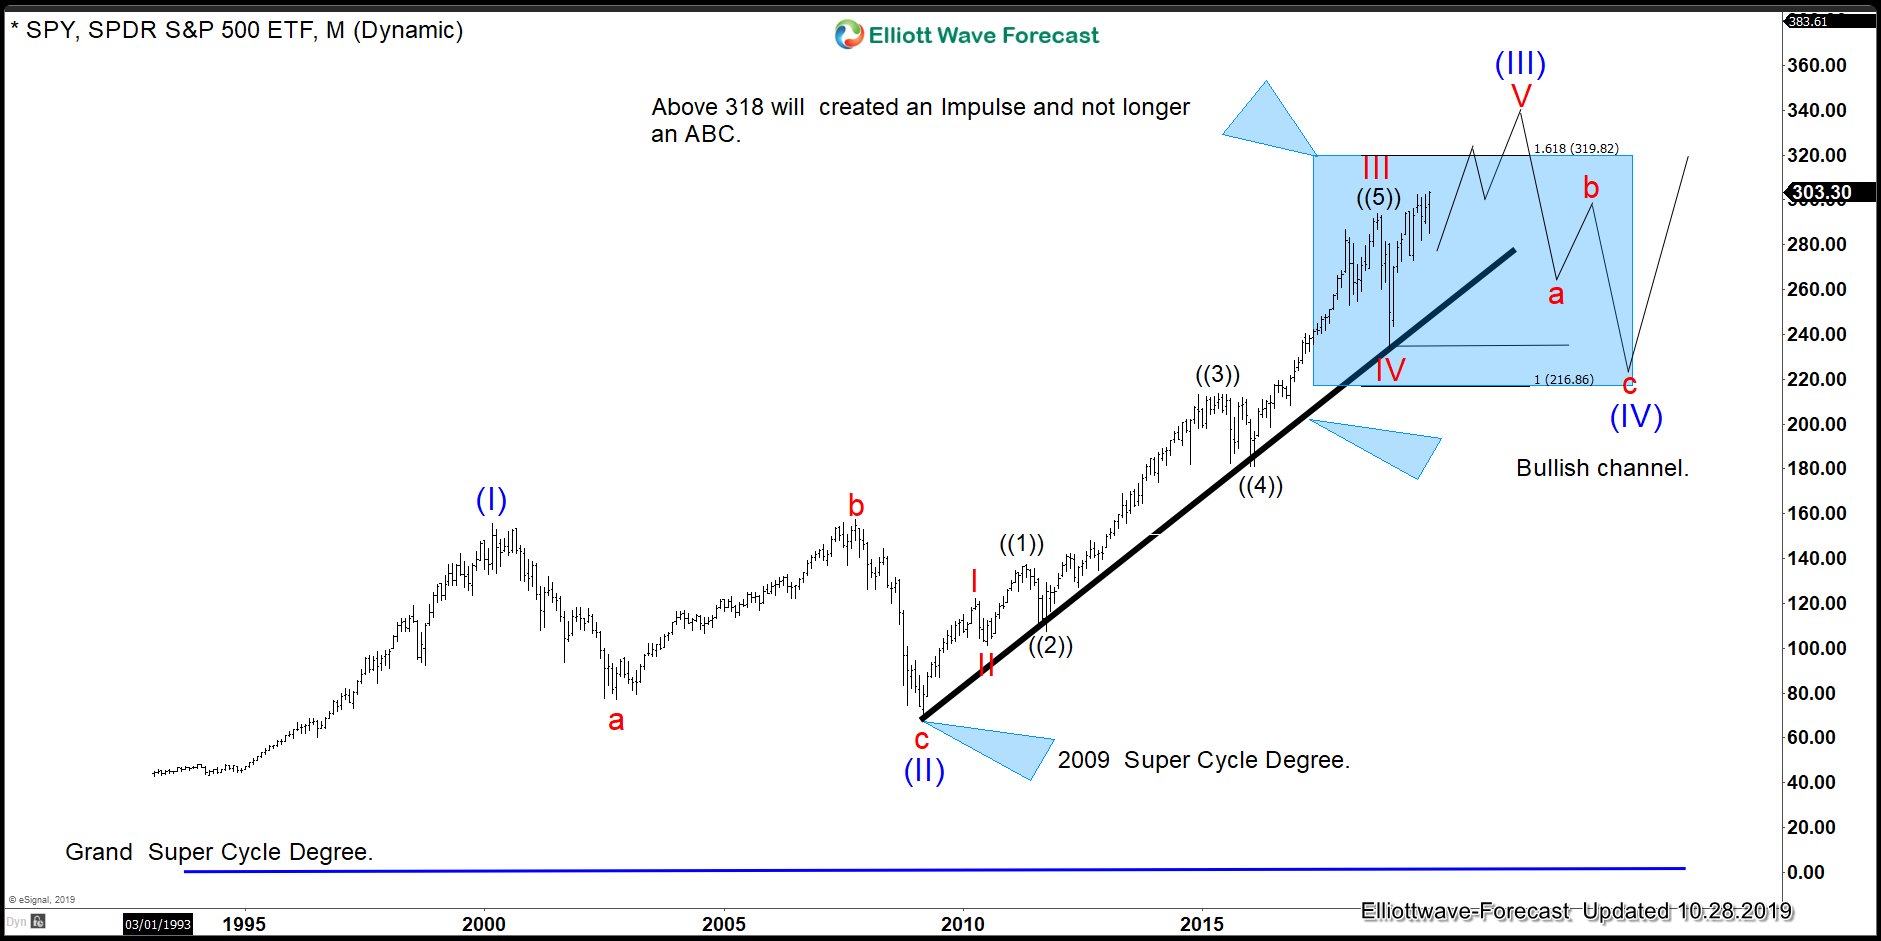
We look at more than 100 instruments in daily basis so we can forecast with a higher degree of accuracy. We have been calling extension in most of the Indices around the world like the following chart of $SPY
Monthly $SPY Elliott Wave Chart
One group which correlates with Indices well is the Yen pairs. By looking at the chart of $SEKJPY below, we can also get confirmation on the upside bias in Indices
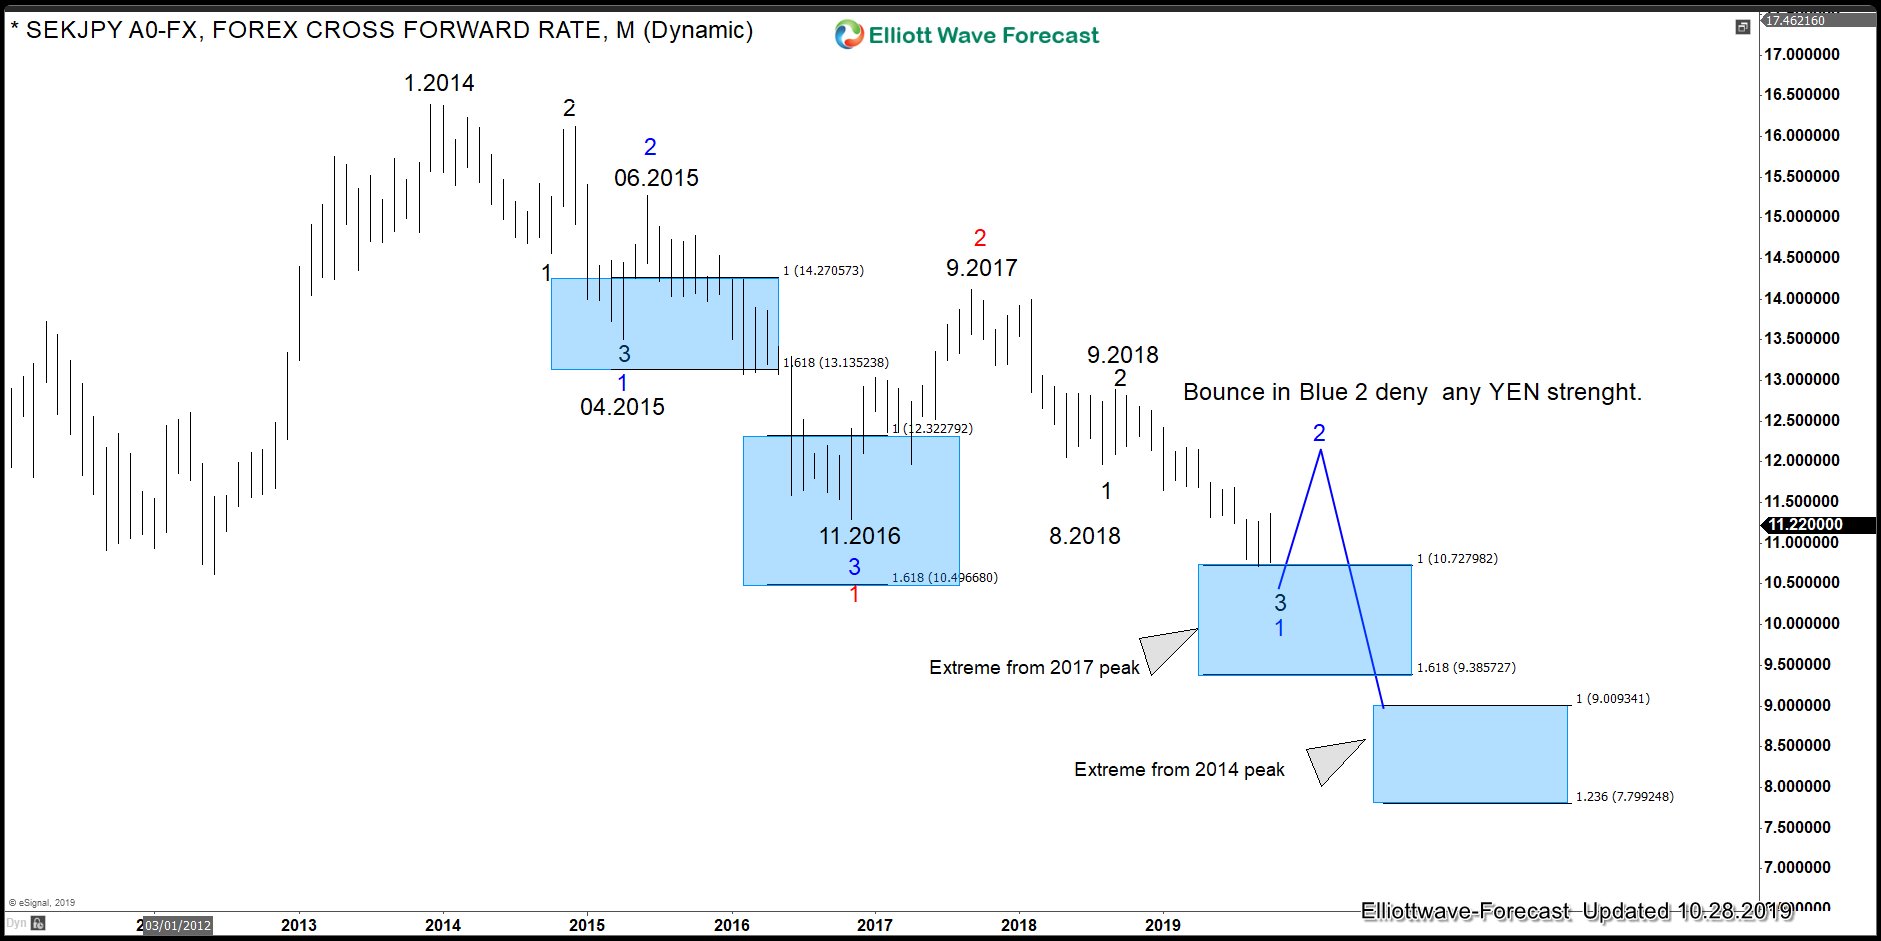
The above chart shows $SEKJPY weekly Elliott Wave sequences. The pair has reached 100% extension from 2017 high as indicated by reaching the Blue Box and it is due for a bounce in Blue 2. $SEKJPY bouncing means a Yen weakness and not a Yen strength. For the Indices to drop, the Yen need to be strong but this is not possible because $SEKJPY has reached the blue box. The bounce in $SEKJPY thus call for an extension in all risk instruments. This analysis and conclusion are based on multi-market correlation and the one market concept.
Weekly Google Elliott Wave Chart
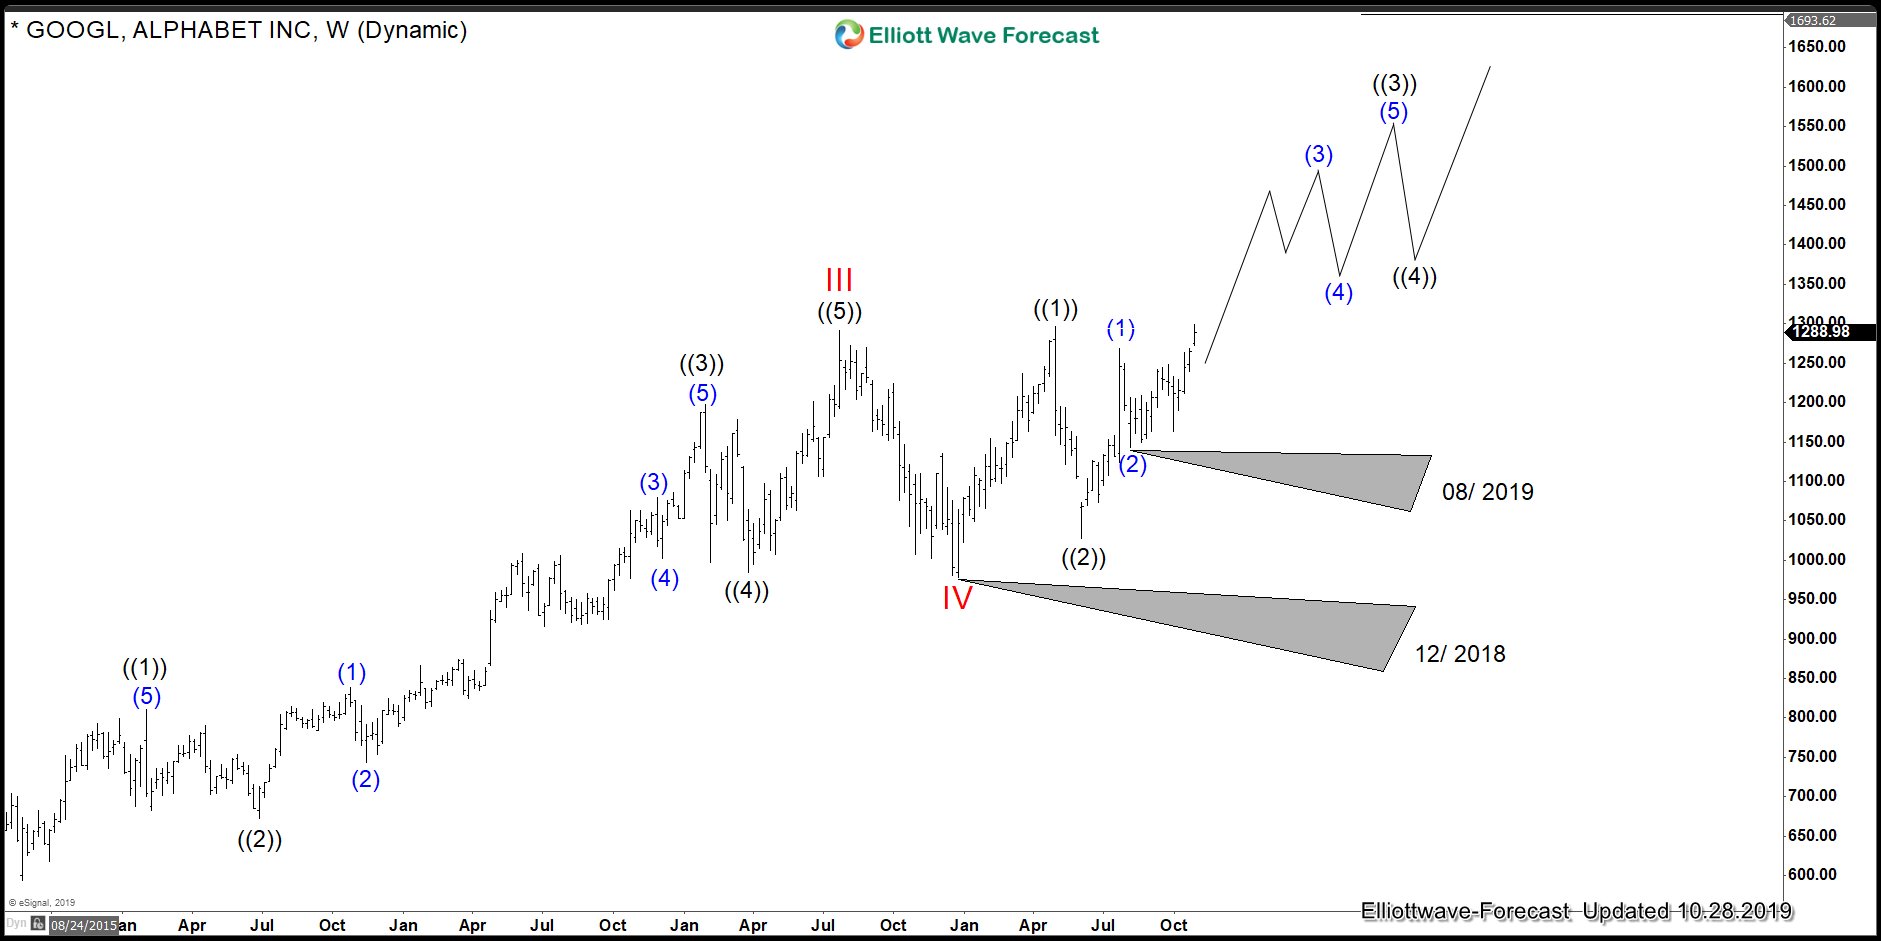
We believe Google has created a nest within wave V. A nest creates the impression of a sideways move and double top when in reality it can accelerate higher with the trend. The right side therefore remains higher as we show in the above chart. Google is in a nest with the acceleration taking place sometimes next month.