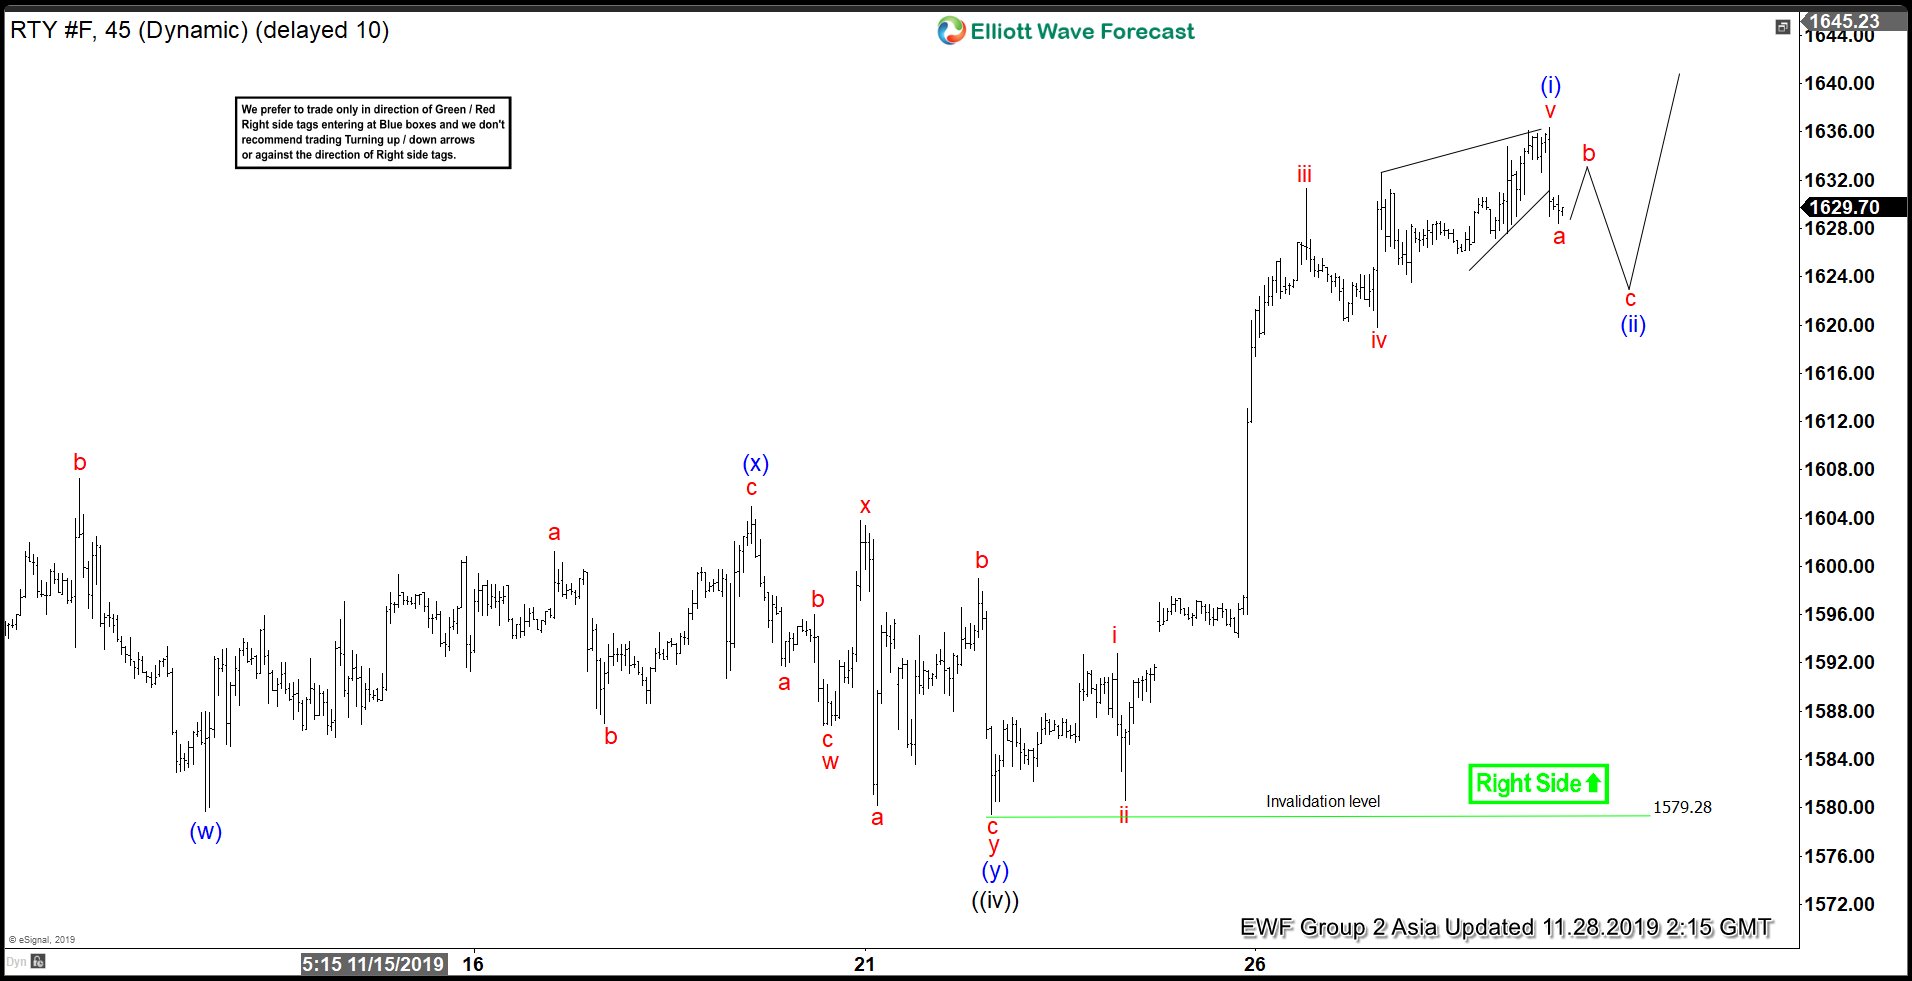
Rally in in Russell 2000 (RTY_F) from October 3, 2019 low is unfolding as 5 waves impulsive Elliott Wave structure. The chart below shows wave ((iv)) of the impulse ended at 1579.28. Index is currently within wave ((v)) before ending the cycle from October 3 low. Up from wave ((iv)), wave i ended at 1592.8 and wave ii pullback ended at 1580.60. Index then resumes higher in wave iii towards 1631.3 and wave iv pullback ended at 1619.80. Wave v of (i) is proposed complete at 1636.40.
Index should now pullback in wave (ii) to correct cycle from November 21 low (1579.28) before the rally resumes. We don’t like selling the proposed pullback. As far as pivot at 1579.28 stays intact, expect dips to find buyers in 3, 7, or 11 swing for more upside. Alternatively, instead of ending wave (i) of ((v)), the 5 waves move higher from 1579.28 can also complete the entire wave ((v)) already. In this case, Index should then end a larger 5 waves cycle from October 3 low. The pullback will be a larger degree correction to correct the entire 5 waves up from October 3 low before the rally resumes again.
RTY_F 1 Hour Elliott Wave Chart