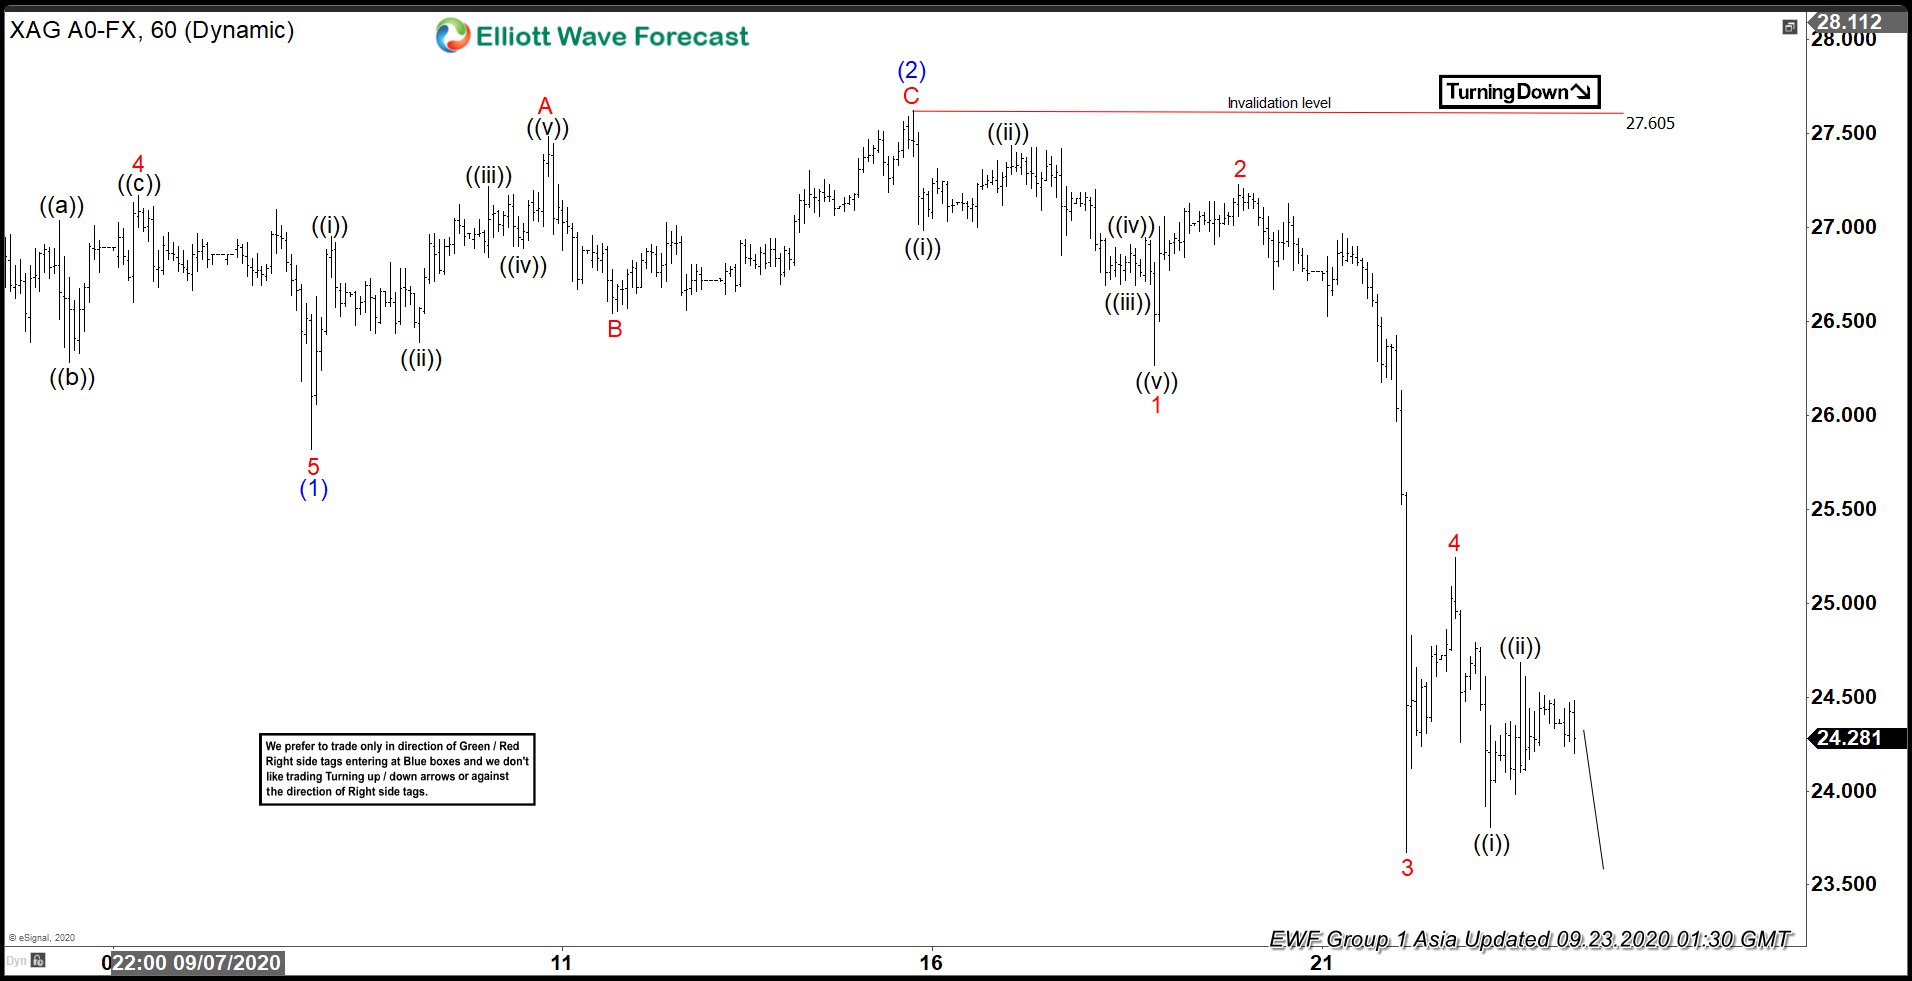
Elliott Wave View of Silver (XAG) suggests the cycle from September 1 high has ended as wave (1) at 25.82 low. From there, the metal bounce higher in wave (2). The correction unfolded as zigzag Elliott Wave Structure. Up from wave (1) low, wave A ended at 27.48 high. The dip in wave B ended at 26.54 low. Afterwards, the metal resumed higher and ended wave C at 27.60 high. This ended wave (2) in the higher degree. Since then, the commodity has resumed the decline lower.
Down from wave (2) high, wave 1 ended at 26.26 low. The subdivision of wave 1 unfolded as 5 waves impulse structure. Wave ((i)) ended at 26.98 low and wave ((ii)) bounce ended at 27.43 high. Wave ((iii)) lower ended at 26.69 low and wave ((iv)) bounce ended at 26.94 high. The push lower in wave ((v)) ended at 26.26 low. The metal then bounced higher in wave 2, which ended at 27.22 high. Afterwards, the metal resumed lower in wave 3, which ended at 23.67 low. The bounce in wave 4 ended at 25.24 high. Currently, wave 5 is in progress. As long as 27.60 stays intact, expect the bounces in 3,7 or 11 swings to fail for more downside. The 100 - 161.8% extension from August 7 high is at 18.36 - 22.39 area. If reached, that area can see support for 3 waves bounce at least.
Silver (XAG) 1 Hour Elliott Wave Chart