Great post and analysis, thank you.
Let’s see the correction movement will continue next week.
The EUR/USD gets a break and tries to recover from the recent drops, but the downtrend stays intact.
Goldman Sachs cut its long-term forecasts for the euro on Friday, unrelated to the US payrolls data. It expects the euro to fall to $1.14 in three months, $1.11 by June and $1.08 by year-end. But it also expects euro parity with the dollar by the end of 2017.
After eur/usd’s recovery attempt on Friday, I suspect further recovery might follow, on the upside resistance lies at the 1.1900 level.
The EURUSD initially broke down below the 1.18 level during Friday’s session, but found enough buyers to turn things back around and close near the high of the day. Now the million dollar question will this bullish correction turn into a trend change, or will we see another break below 1.1750?
EUR/USD failed to break the support 1.1782 (S1) and recovered to reach the resistance formed by the upper limit of the downward channel in the short term 1.1866 (R1).
The positive divergence between the RSI and the price-action with both momentum indicators rising.
However the long-term trend is downward which urges caution and wait for more consistent signals.
R3 - 1.19500
R2 - 1.18978
R1 - 1.18663
Daily Std. Pivot - 1.18141
S1 - 1.17826
S2 - 1.17304
S3 - 1.16989
After the double bottom it formed last week and the move to the upside EUR/USD dropped again but couldn’t even reach the support at 1.1750 before it formed another hammer in the 4 hour filter chart. It looks like the pair is consolidating again before it continues on its way down to 1.1700.
I agree with you but what i see is it wont last so long.
The market looks indecisive. hammer on the daily and on the 4 hour chart but the volatility of the market is weak
EURUSD initially fell during the yesterday session but found enough support at 1.18 handle to bounce upon significant buying pressure and close in the middle of the daily range. The pair is consolidating but we may expect an upside correction before the next leg down.
EUR / USD slightly moved downward yesterday, but after finding support slightly above our line of 1.1788 (S1), recovered to “play” again the resistance line of 1.1873 (R1).
Since there is positive divergence between the RSI and the price action, and that both our momentum indicators continued to rise, is likely to take a drive up to 1.1873 (R1) and a possible approach to the resistance line of 1.1914 (R2).
After all the long-term trend continues downward.
R3 - 1.19579
R2 - 1.19142
R1 - 1.18731
Daily Std. Pivot - 1.18294
S1 - 1.17883
S2 - 1.17446
S3 - 1.17035
The EURUSD has been consolidating, but the downtrend is still in place and further drops could be seen.
EUR/USD consolidation continued today too. The pair tested the support at 1.1750 but couldn’t break below it and bounced back. I wonder how long the consolidation is going to last this time.
price broke 1.1800 so I guess it wont be long until 1.1750 will be broken
Very useful, thank you honeill.
Could the EURUSD be taking a break to continue going lower? It could be possible, pay attention to further loses on this pair.
EURUSD fell on yesterday session reaching a new low at 1.1752 but has ultimately failed there again and has since rallied back toward 1.18 handle. This comes after the pair found strong selling at its 10-day moving yesterday. Looking at a technically sound downtrend, though momentum has slowed and this is evident in the form of the mostly sideways channel we have seen since January 7th. This is the most consolidation we have seen since the rally toward 1.26 in mid-December, increasing the odds that we could see a more substantial bullish correction here toward 1.20 or, at least, more sideways consolidation.
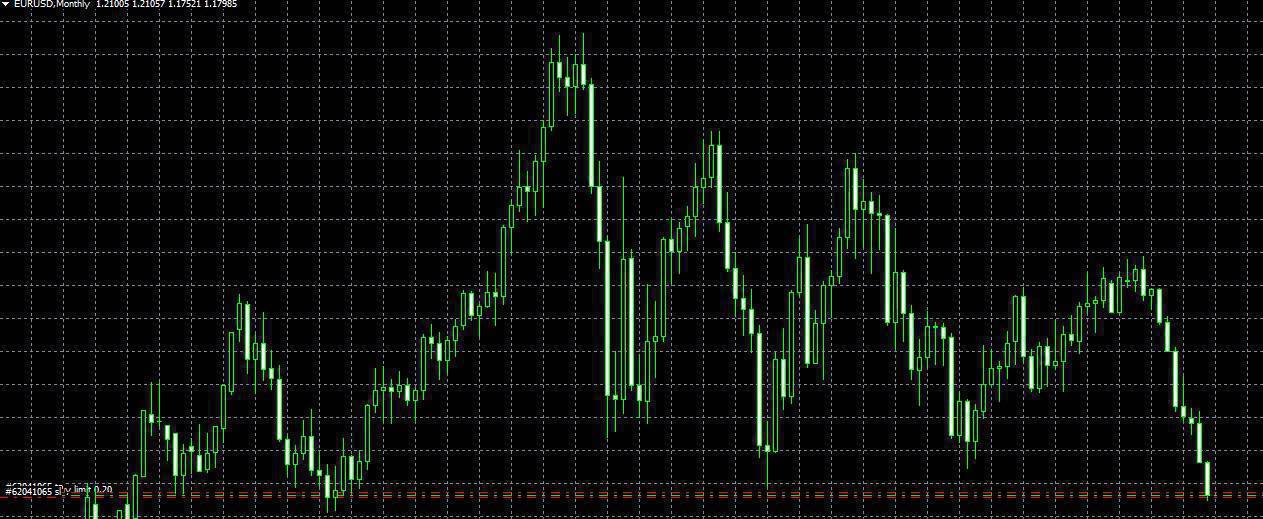
Hi eurusd has been falling steadily but it now approaches new lows that were there since 2005. I notice that there’s strong resistance to that level and have noticed on the monthly time frame and zooming out that this chart has had 3 lows and everytime it reached a certain historic low it would rebound backwards pretty high.
This is the monthly timeframe. See the present price is already shooting past the 2 lows earlier i think in 2010 and 2012 and notice how it rebounded up very high again
Bet not many expected todays rollercoaster for the eur/usd?
Down to 1.17300
Up to 1.18400
Currently falling down again, now at 1.18000
Plenty of pips to grab!