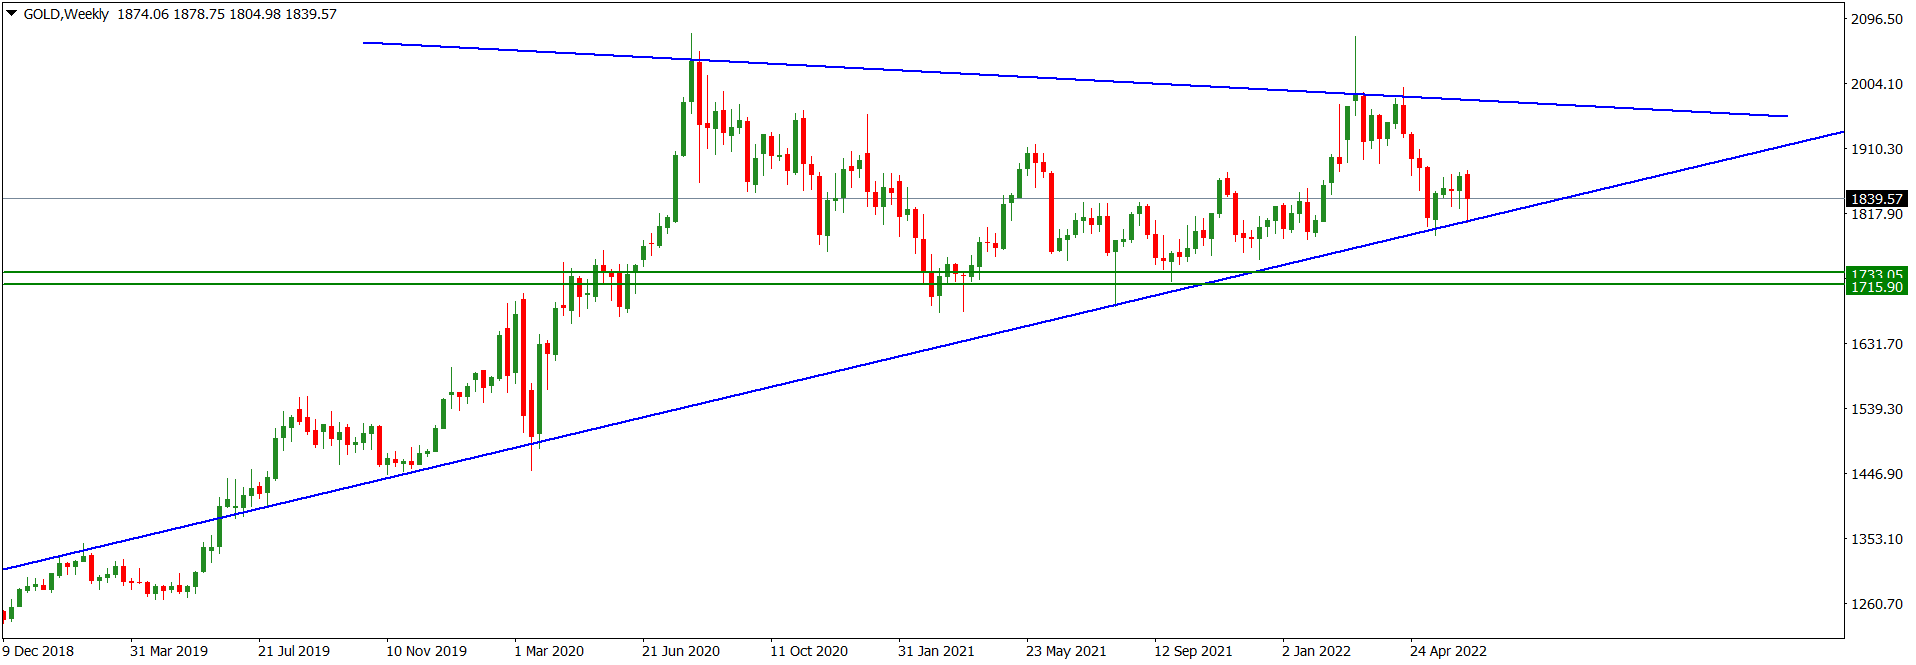
XAUUSD Weekly Technical Outlook
XAUUSD market operation on the weekly time frame is in a rising wedge (blue). It went sideways after testing the wedge support trendline. A bearish breakdown of the wedge may see bears target the 1733.05/1715.90 horizontal support zone (green). But bulls may seize on any bearish misstep to retest the 1905.90 horizontal resistance.
XAUUSD price action on the daily time frame is consolidating within the 1872.54/1807.10 range (blue). Presently, it is located at the 1839.57 minor horizontal support where the technical impulse favours bears more than bulls.
XAUUSD price action on the H4 time frame is consolidating in a rising channel (dark violet) or flag in the context of a bearish structure. Although technicals favour bears more than bulls, we may still have further northward engineering before a bearish continuation.
I may be wrong. Trade safe and prosper.
Trap
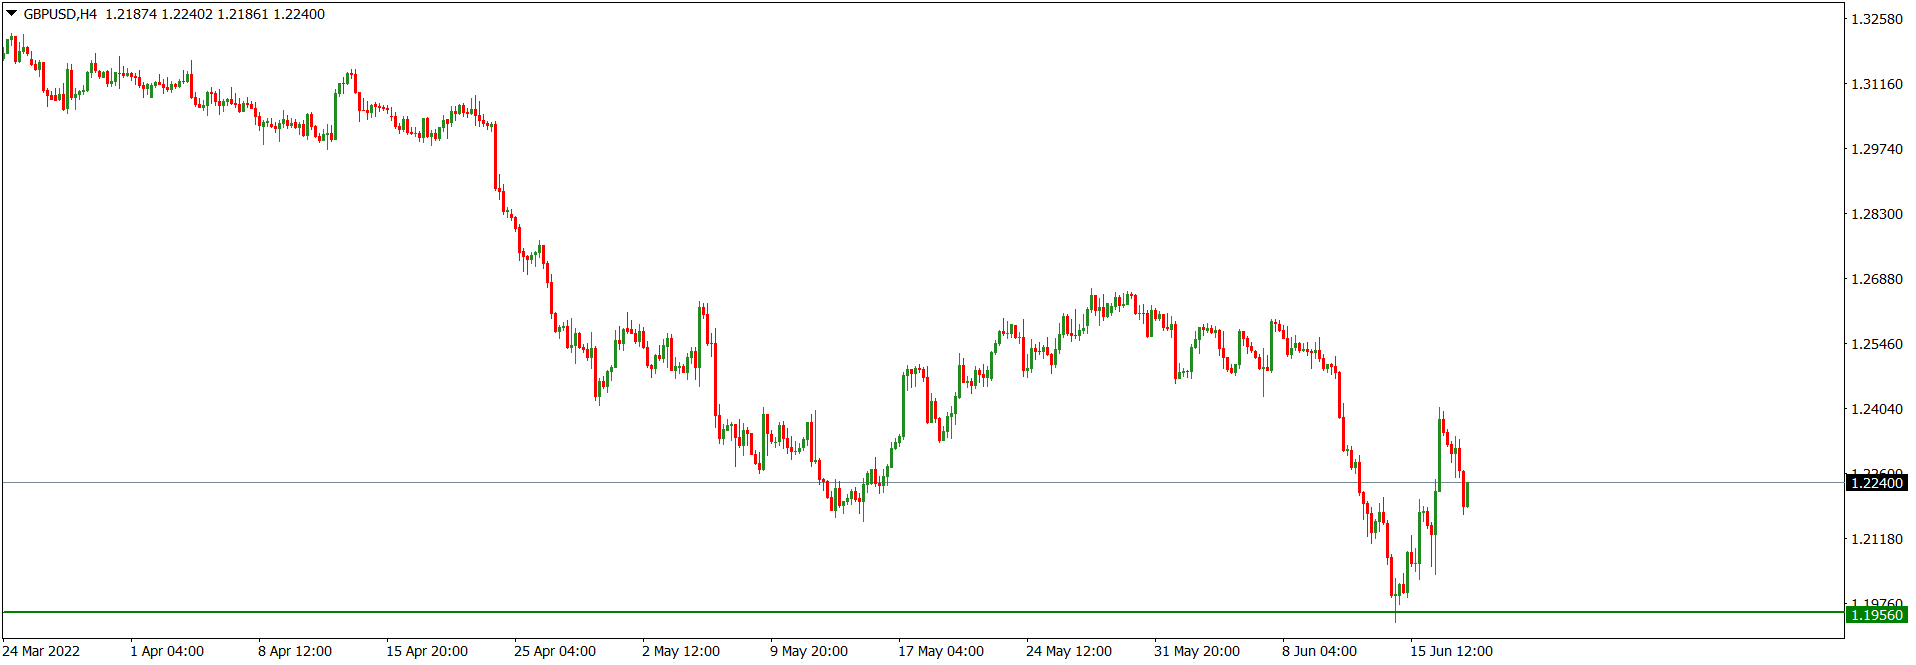
GBPUSD Weekly Technical Outlook
Last week, GBPUSD market operation on the weekly time frame broke down the 1.22400 multi-year support zone, then surged further southwards to retest the 1.19560 longer-term horizontal support zone (green). A bullish pushback led to market operation closing at the broken down 1.22400 handle, resulting in the printing of a long-tailed bearish candlestick. Technically, we can expect another bearish attempt to break down the 1.19560 longer-term horizontal support zone (green).
GBPUSD price action on the daily time frame turned sideways after a 61.8/78.6 zonal retracement of the 1.25950/1.19330 bearish swing. Technically, any further bullish move will be temporary, giving way to a bearish turnaround.
GBPUSD price action on the H4 time frame is sideways in the context of a bullish retracement of a bearish swing. Although we may see further bullish market engineering, a southward turnaround is imminent.
I may be wrong. Trade safe and prosper.
Trap
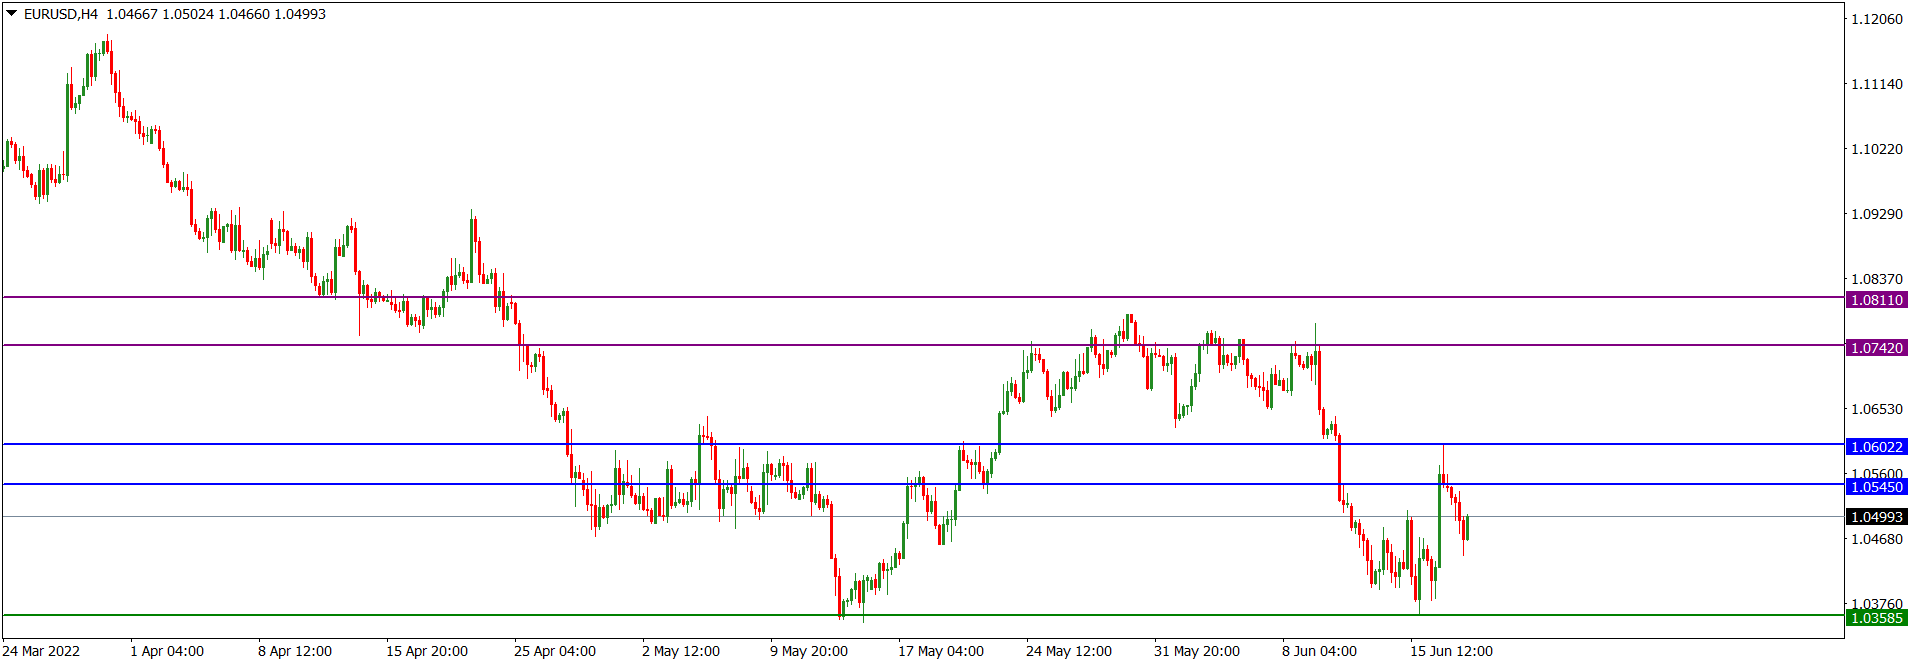
EURUSD Weekly Technical Outlook
EURUSD market operation on the weekly time frame is bearish. Last week, market operation made a bearish dive to the 1.03585 multi-year horizontal support area (green) before a bullish pullback, resulting in the printing of a doji-like candlestick. Technically, we may see another bearish retest of the area this week. Should there be a bearish misstep, bulls may feel incentivized to retest the 1.07420/1.08110 horizontal resistance zone (purple).
EURUSD price action on the daily time frame turned sideways after a bullish retracement of the 1.07736/1.03584 bearish swing. Presently, it is retesting the1.05450/1.06022 broken-down daily demand zone (blue) and, technically, susceptible to a southward rotation.
EURUSD price action on the H4 time frame made a bullish retest of the 1.05450/1.06022 broken-down daily demand zone (blue) before retracing southwards. But as the last H4 session on Friday was bullish, we may see further northward move before a southward rotation. The technical structure is still favourable to bears.
I may be wrong. Trade safe and prosper.
Trap
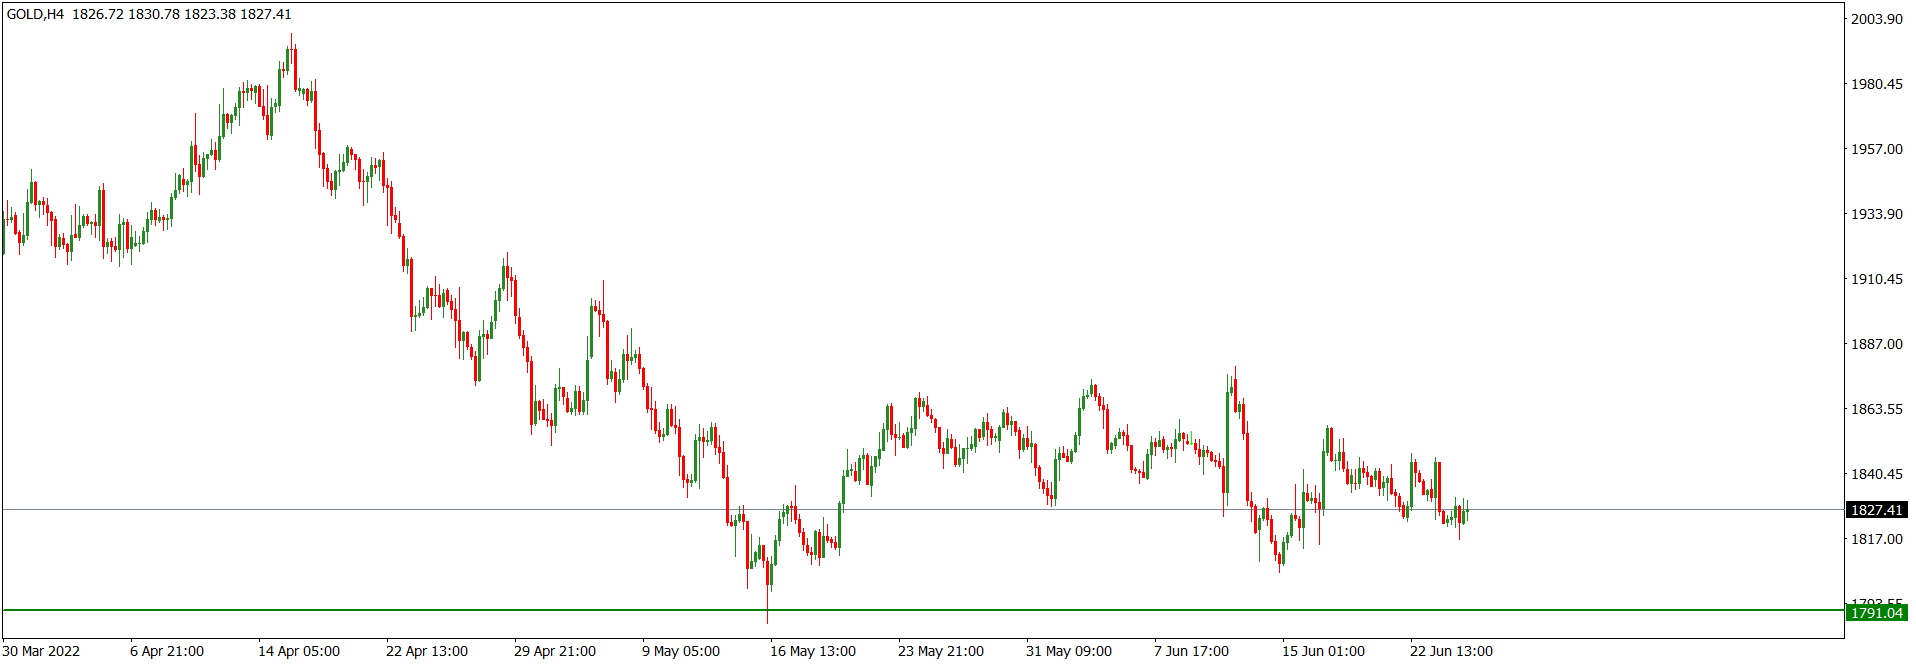
XAUUSD Weekly Technical Outlook
XAUUSD is disposed bearish on the weekly time frame. Seven weeks ago, market operation surged to the 1791.04/1761.04 horizontal support zone (green) and rejected it with a bullish retracement. A sideways of market operation ensued which gave way to a bearish mode last week. We may see bears retesting the 1791.04/1761.04 horizontal support zone (green).
XAUUSD price action on the daily time frame is sideways but technicals favour bears more than bulls. However, as last Friday’s price action printed a bullish candlestick, we may still see further northward move in the early part of this week.
XAUUSD price action is sideways on the H4 time frame in a technically bearish environment. However, as recent technical prints favour bulls, we may see further northward move before a southward turnaround.
I may be wrong. Trade safe and prosper.
Trap
EURUSD Weekly Technical Outlook
EURUSD market operation is retesting the 1.04980/1.037800 multi-year horizontal support zone (green) seen on the monthly time frame. On the weekly time frame, two weeks ago, market operation printed a long-tailed doji-like candlestick in the zone. This was followed by a bullish print which closed about 45 pips just above the zone last week. We may see further bullish move towards the 1.07460/1.08154 horizontal resistance area (purple).
EURUSD price action is in sideway mode on the daily time frame after a bullish push from the 1.04980/1.037800 multi-year horizontal support zone (green). Although we may still see further bullish move, the general technical structure is bearish.
EURUSD price action on the H4 time frame is in a symmetrical triangle (magenta). We may see some northward market engineering before a southward rotation.
I may be wrong. Trade safe and prosper.
Trap
GBPUSD Weekly Technical Outlook
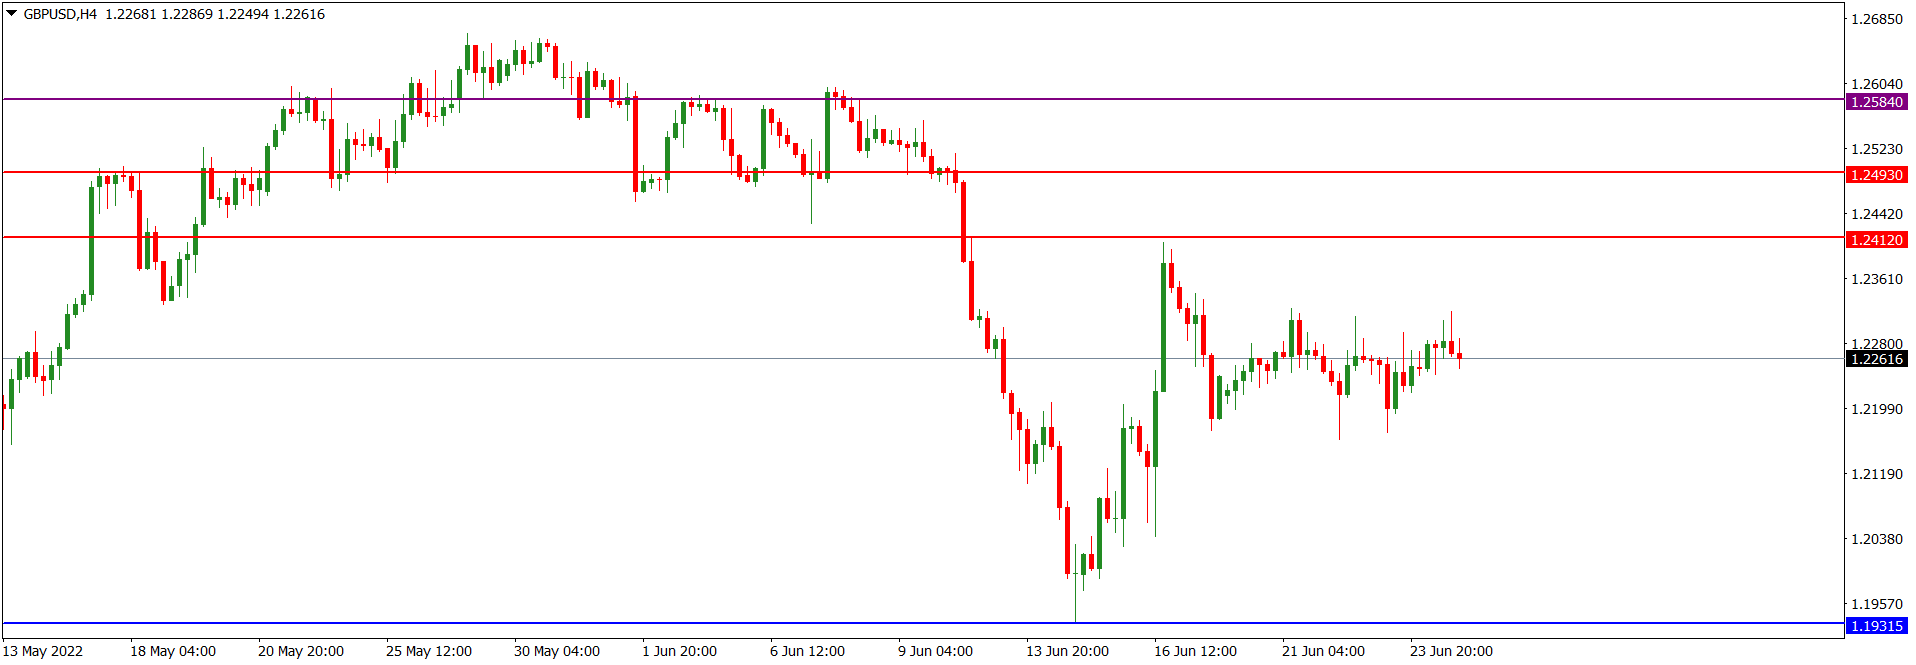
GBPUSD market operation on the weekly time frame is bearish. It has broken down the 1.27430/1.25840 major horizontal support (purple) flipping it as resistance. There was a bullish retracement for some weeks, but it gave way to a bearish turnaround. Market operation consolidated after the bullish print of last week as it tackles the near-term 1.22940 horizontal resistance. Although the bullish pinbar printed two weeks ago may still influence further northward move, any such move would soon give way to a southward turnaround. The 1.19220 area (green) is the operating horizontal support and a likely target of bears.
GBPUSD price action on the daily time frame is sideways in a technically bearish market environment, the 1.30850/1.19315 (blue) bearish trading range. There has been a bearish rejection of the 1.27430/1.25840 major horizontal support (purple) seen on the weekly time frame, but we may still have a northward market engineering for liquidity grab. Personally, I am bearish on this pair, but, as a swing trader, I will await a feasible bearish setup at an area of value, perhaps within the 1.24120/1.24930 area of price imbalance (red).
GBPUSD price action is presently sideways on the H4 time frame after a bullish retracement, but we may still see further northward move. Nevertheless, the recent bottom tailed ‘wicky’ prints on the H4 time frame would be attractive as targets of southward rotation. This may be after further bullish move to, perhaps, retest the prevailing horizontal resistance at the 1.24120/1.24930 area (red), which is integrated to an area of price imbalance on the daily time frame.
I may be wrong. Trade safe and prosper.
Trap
XAUUSD Weekly Technical Outlook
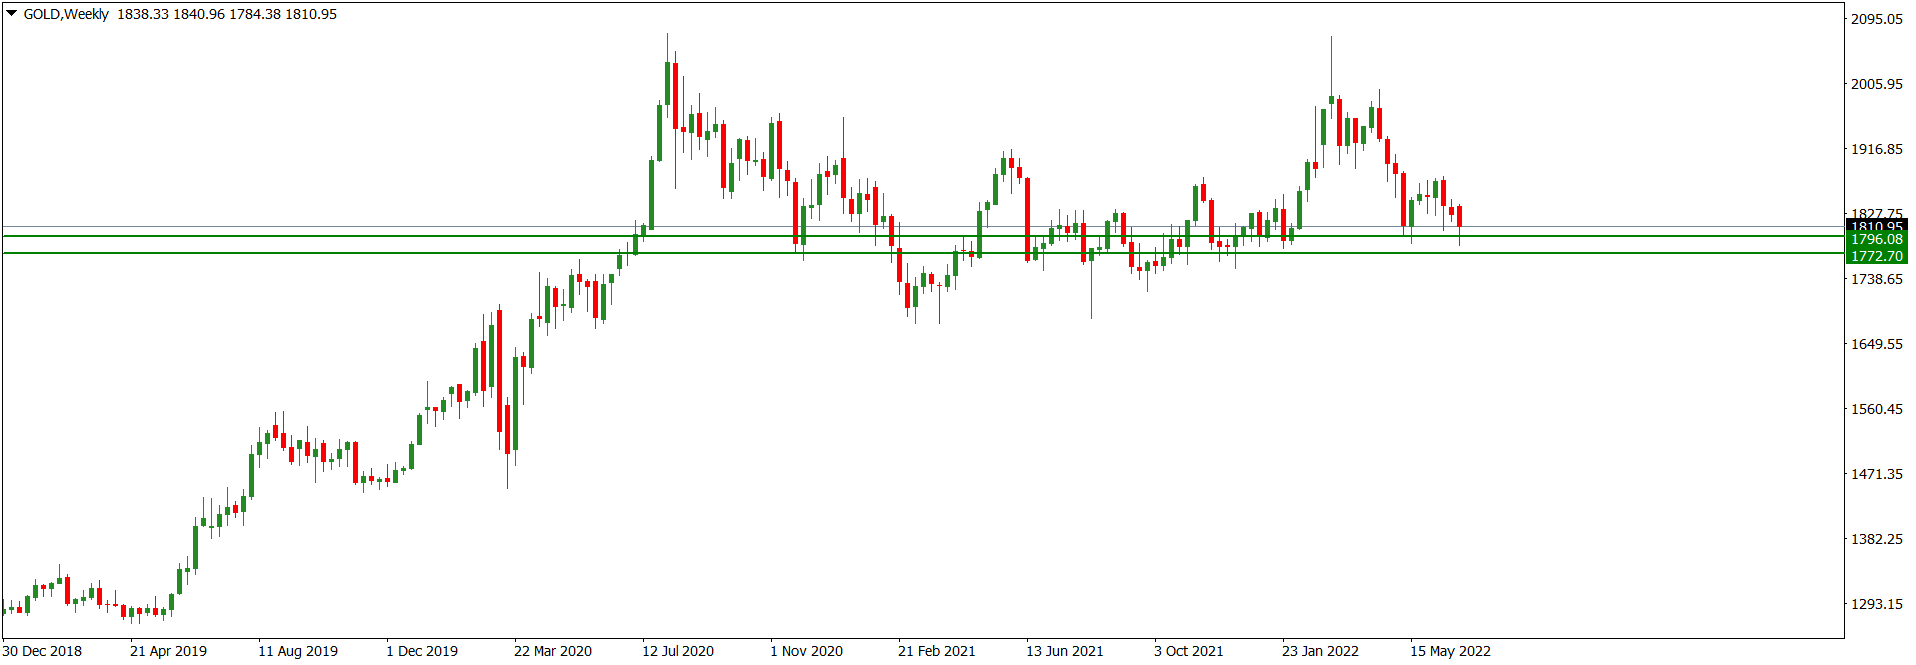
The 1796.08/1772.70 horizontal support zone (green) has remained intact despite several bearish attempts to breach it since November 2021. On the monthly time frame, XAUUSD market operation made a relatively strong bullish drive to the zone in May but failed to break it down and the bearish follow-up in June met a bullish pushback at the upper part of the zone. Technically, we may see further see-saw of market operation at the zone, or even some bullish pushback, before further bearish drive.
XAUUSD market operation on the weekly time frame is largely sideways as it tackles the 1796.08/1772.70 horizontal support zone (green) seen on the monthly time frame. Despite the zone witnessing several bearish attacks, it has remained unbroken. The bearish surge to the zone last week was again met with bullish pushback, resulting in the printing of a bearish candlestick with a significant bottom wick. Although technicals still favour bears more than bulls, we may still see some bullish pushback before further bearish continuation.
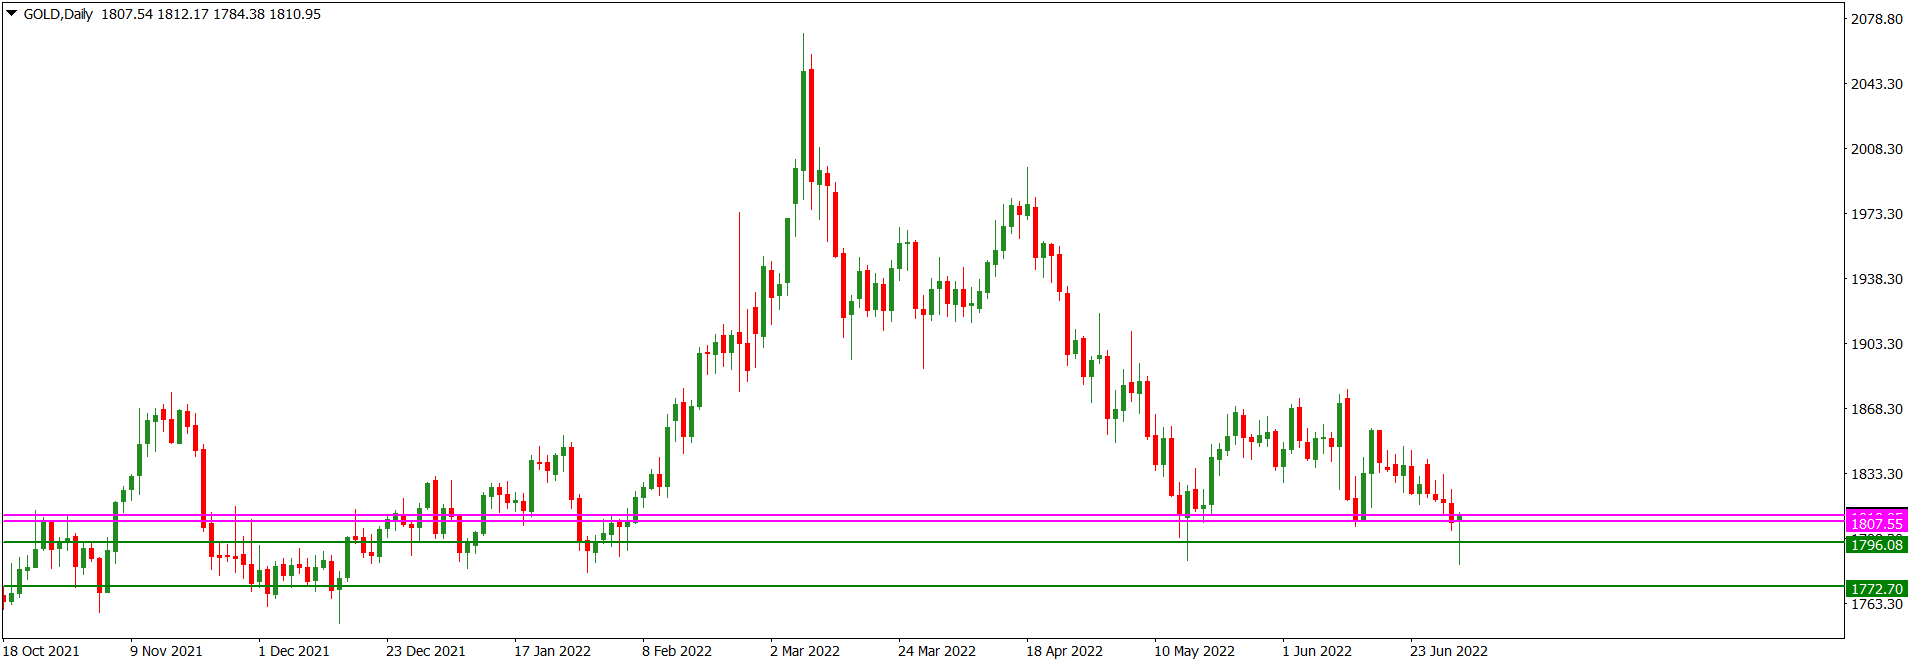
XAUUSD price action on the daily time frame is tackling the 1796.08/1772.70 horizontal support zone (green) seen on the monthly time frame. The most recent bearish attack at the zone has met with bullish rejection. Presently, price action is located at the minor 1807.55/1810.95 horizontal resistance area (magenta), technically an area where we can expect some bearish challenge. At any rate, any bullish move will likely be temporary, giving way to a bearish rotation.
I may be wrong. Trade safe and prosper.
Trap
USDJPY Weekly Technical Outlook
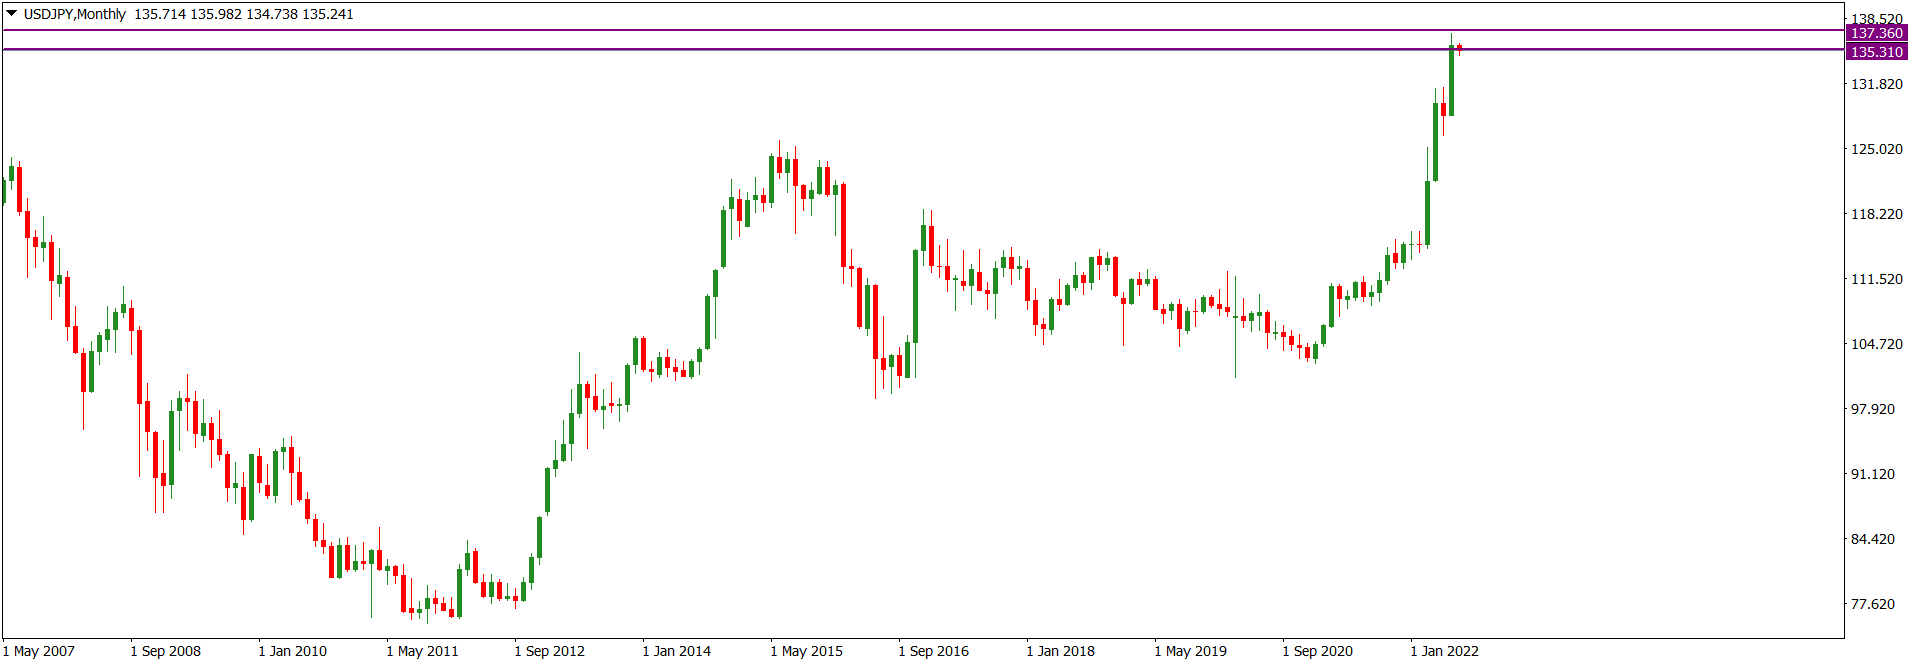
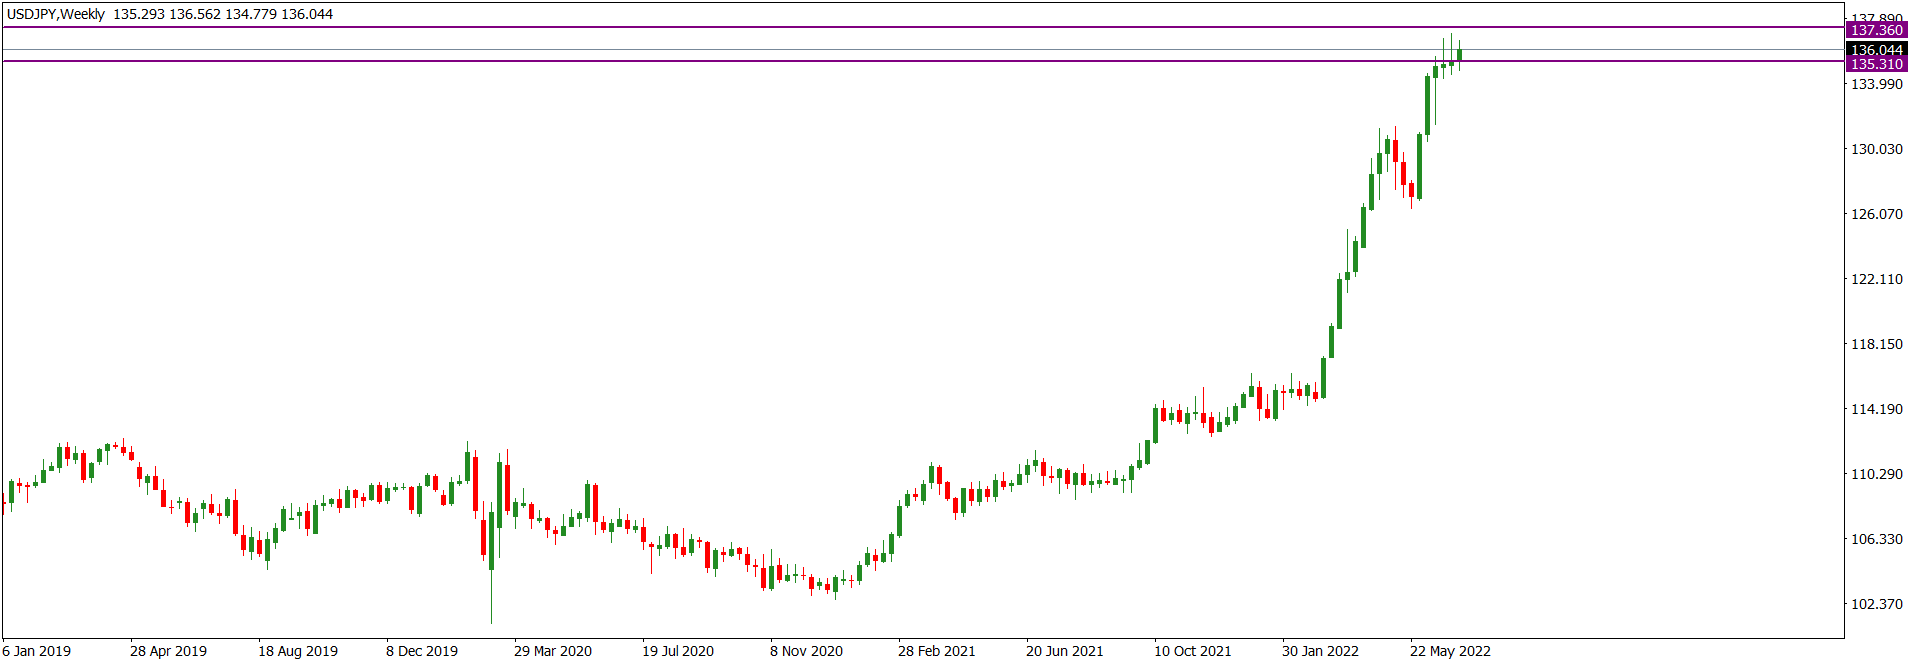
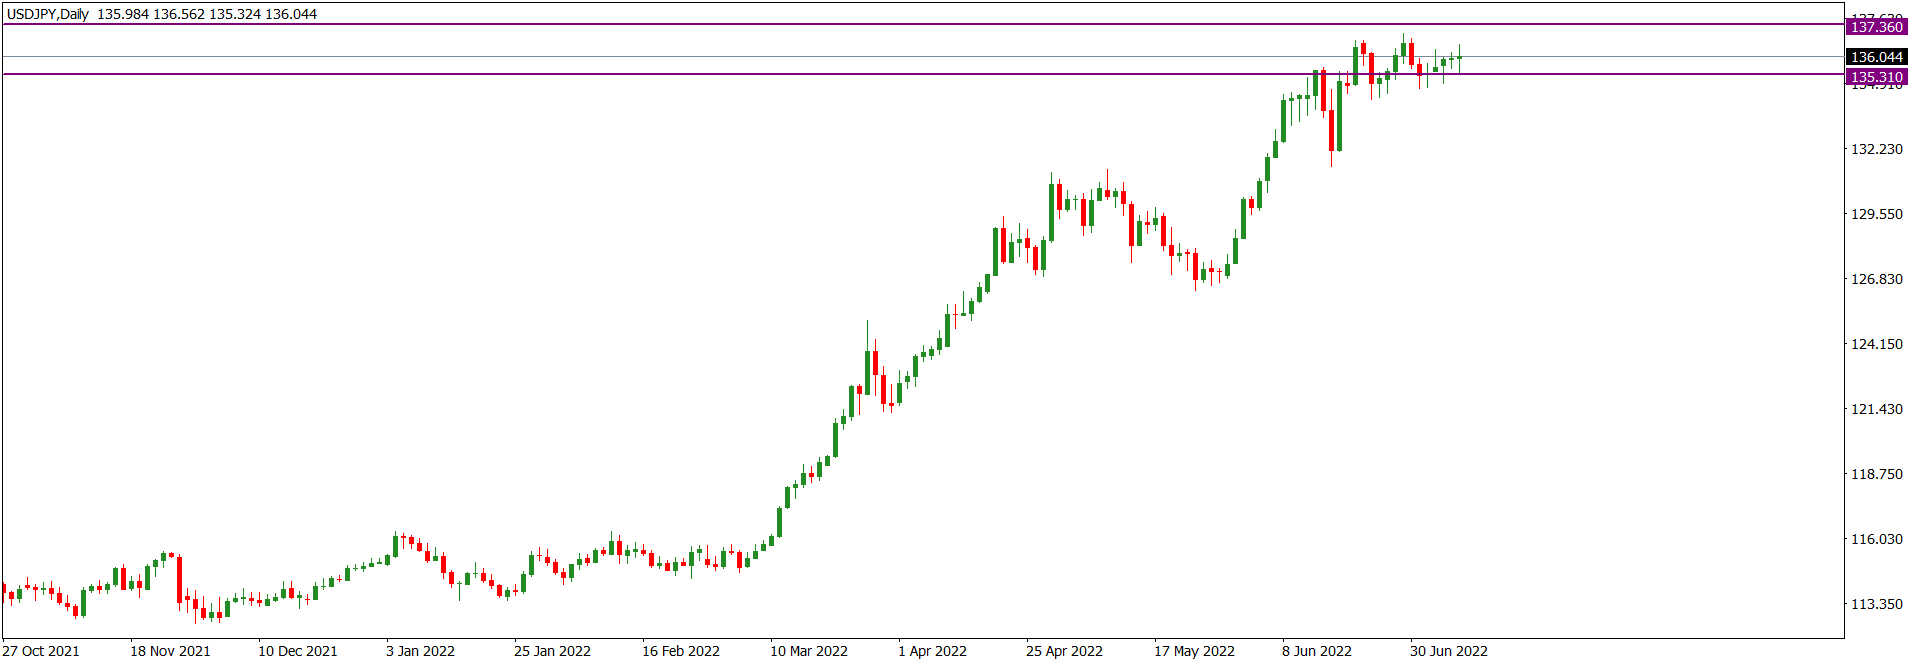
USDJPY continued its bullish disposition in June. On the monthly time frame, market operation surged to the 135.310/137.360 multi-year horizontal resistance zone (purple). However, the shadow on the top of the bullish candlestick printed in June is indicative of an increased bearish pressure as market operation tackles the zone.
USDJPY market operation on the weekly time frame is sideways as it tackles the 135.310/137.360 multi-year horizontal resistance zone (purple) seen on the monthly time frame. Although the technicals still favour bulls more than bears we may see a bearish pullback as market operation tackles the zone. If the rising channel (blue) is being respected, we may see a pullback to retest the channel support trendline before further bullish drive.
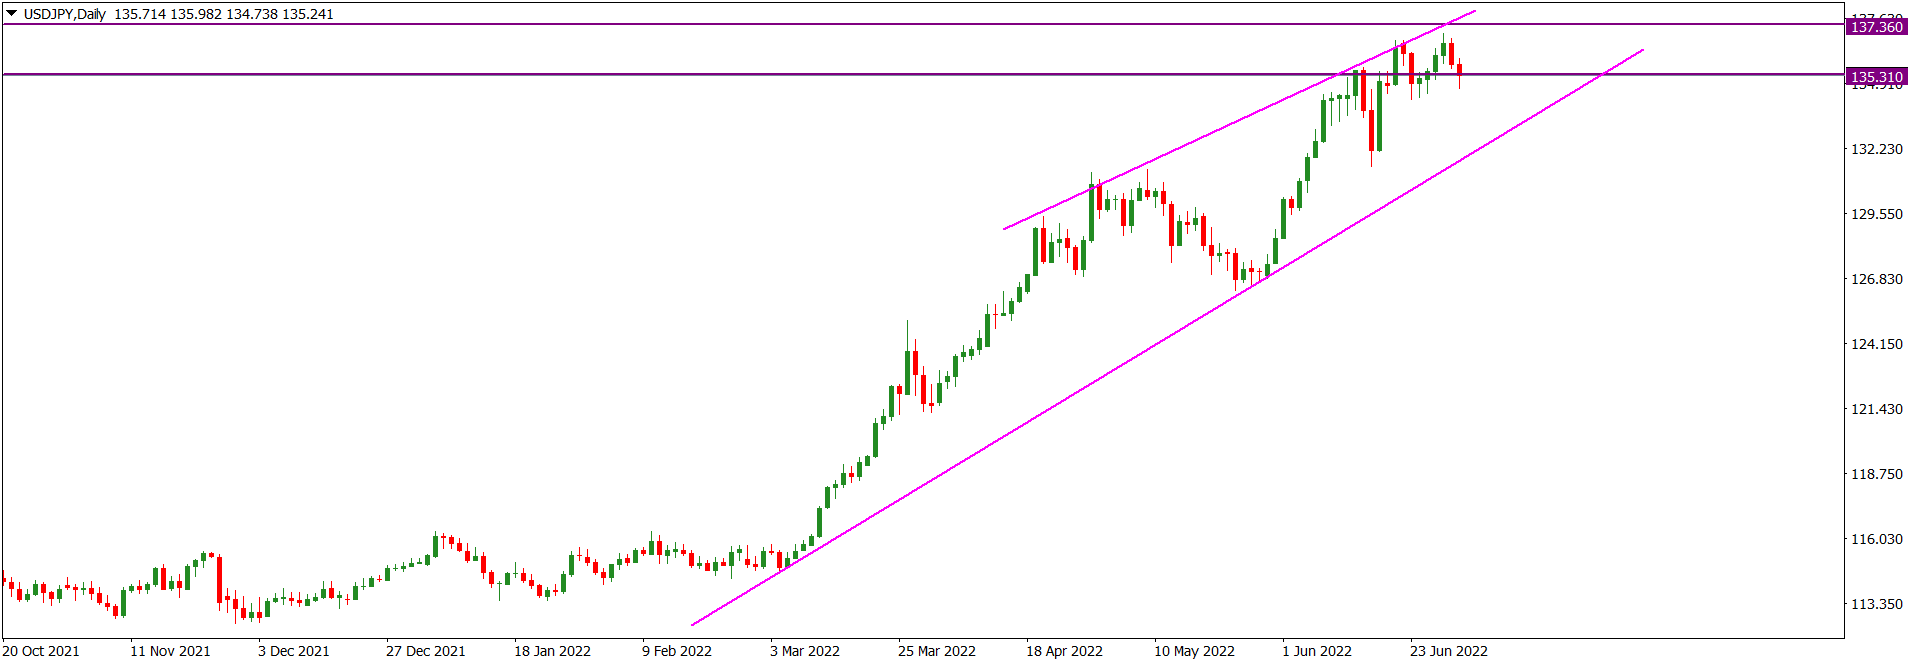
USDJPY price action on the daily time frame is in a rising wedge (magenta) but presently sideways as it tackles the 135.310/137.360 multi-year horizontal resistance zone (purple) seen on the monthly time frame. As price action is losing bullish impetus, we may see a bearish pullback before a northward continuation.
I may be wrong. Trade safe and prosper.
Trap
GBPUSD Weekly Technical Outlook
GBPUSD market operation surged to the 1.20780/1.19590 significant horizontal support zone (green) on the monthly time frame in June. However, it was resisted by bulls, resulting in the printing of a bearish candlestick with a bottom tail.
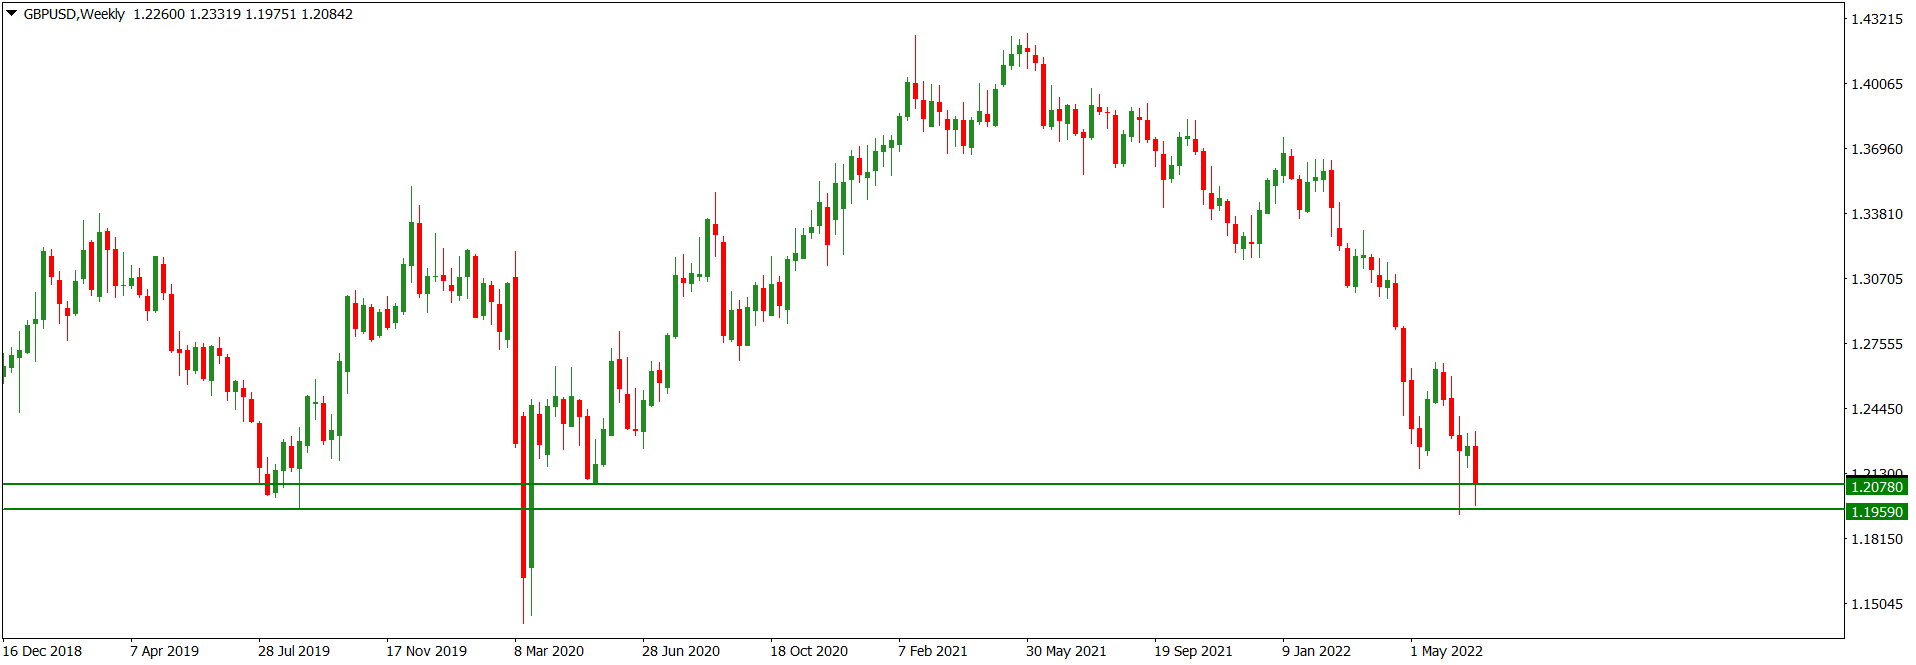
On the weekly time frame, three weeks ago, GBPUSD market operation surged to the 1.20780/1.19590 significant horizontal support zone (green) seen on the monthly time frame but met a strong bullish pushback resulting in the printing of a long-tailed bearish candlestick. A bullish print was made two weeks ago to place market operation in a sideway-mode. However, last week, a bearish market operation broke below the range to retest the 1.20780/1.19590 significant horizontal support zone (green). As market operation left a bottom shadow on the bearish candlestick printed last week, we may see bulls pushing for a northward retest of an area of value before any further bearish drive.
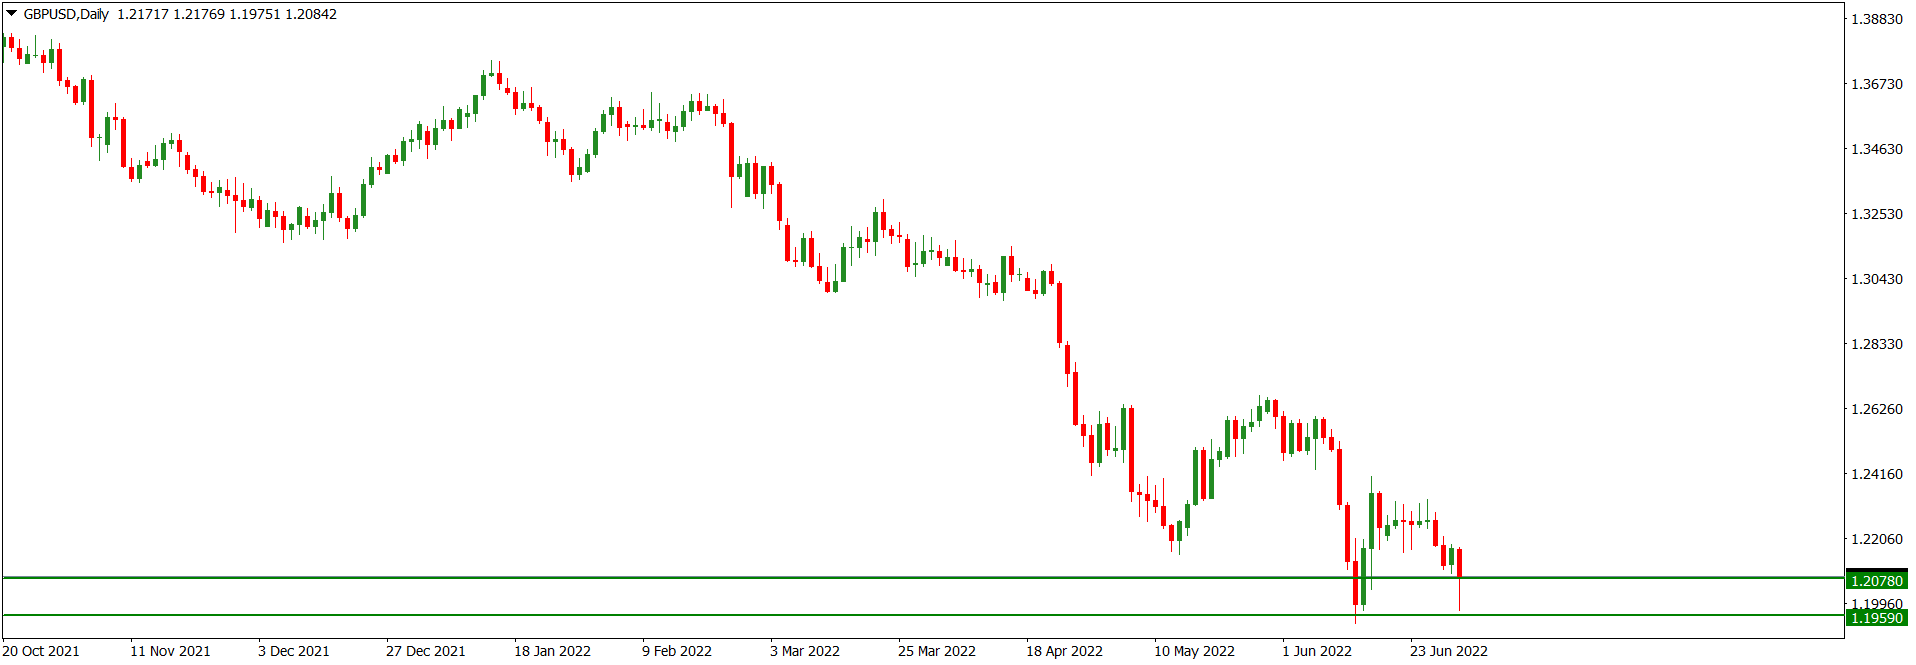
GBPUSD price action on the daily time frame is sideways as it tackles the 1.20780/1.19590 significant horizontal support zone (green) seen on the monthly time frame. However, the top ‘wicky’ prints on recent candlesticks may incentivize bullish interest for northward market engineering before a bearish turnaround.
I may be wrong. Trade safe and prosper.
Trap
EURUSD Weekly Technical Outlook
EURUSD market operation retested the 1.05210/1.03240 multi-year horizontal support zone (green) in April. On the monthly time frame, there was a bullish rejection of the area, but lacking further bullish impetus in June, bears regained market influence and surged into the zone. The 1.01924 area (blue) is a nearby extension of the zone and may be a target of any further bearish drive.
On the weekly time frame, EURUSD market operation is ranging within the 1.05210/1.03240 multi-year horizontal support zone (green) seen on the monthly time frame. Last week, a relatively big bearish print broke below the open of the bullish candlestick printed two weeks ago. Although we may still see further bearish move, we cannot rule out a bullish market operation to an area of price imbalance, a situation which may favour a sell-swing trade.
Despite several attempts, EURUSD price action on the daily time frame has failed to break down the 1.05210/1.03240 multi-year horizontal support zone (green) seen on the monthly time frame. Presently, it is sideways within the zone, but recent technical pattern favours a bullish retracement, perhaps to retest an area of value, such as the 1.06514/1.07470 horizontal resistance area (magenta), before further bearish drive.
I may be wrong. Trade safe and prosper.
Trap
XAUUSD Weekly Technical Outlook
XAUUSD market operation on the weekly time frame broke down the 1796.08/1772.70 former horizontal support zone (purple) which had been in place since October 2021, flipping it as resistance. Presently, market operation is tackling the 1726.82 horizontal support area (green), but bulls are resisting its breakdown.
XAUUSD price action on the daily time frame is sideways as bulls resist the breakdown of the 1726.82 horizontal support area (green) seen on the weekly time frame. Technically, we may see a bullish pullback before further bearish drive.
XAUUSD price action on the H4 time frame is undergoing a bullish correction. We may see further northward move before a southward rotation.
I may be wrong. Trade safe and prosper.
Trap
USDJPY Weekly Technical Outlook
USDJPY market operation is bullish. On the weekly time frame, market operation is presently tackling the 135.310/137.360 multi-year horizontal resistance zone (purple). But despite the bullish mode, the bullish momentum has declined.
Although USDJPY price action on the daily time frame is technically bullish, it is presently sideways as it tackles the 135.310/137.360 multi-year horizontal resistance zone (purple). This may result in a bearish correction before further bullish drive.
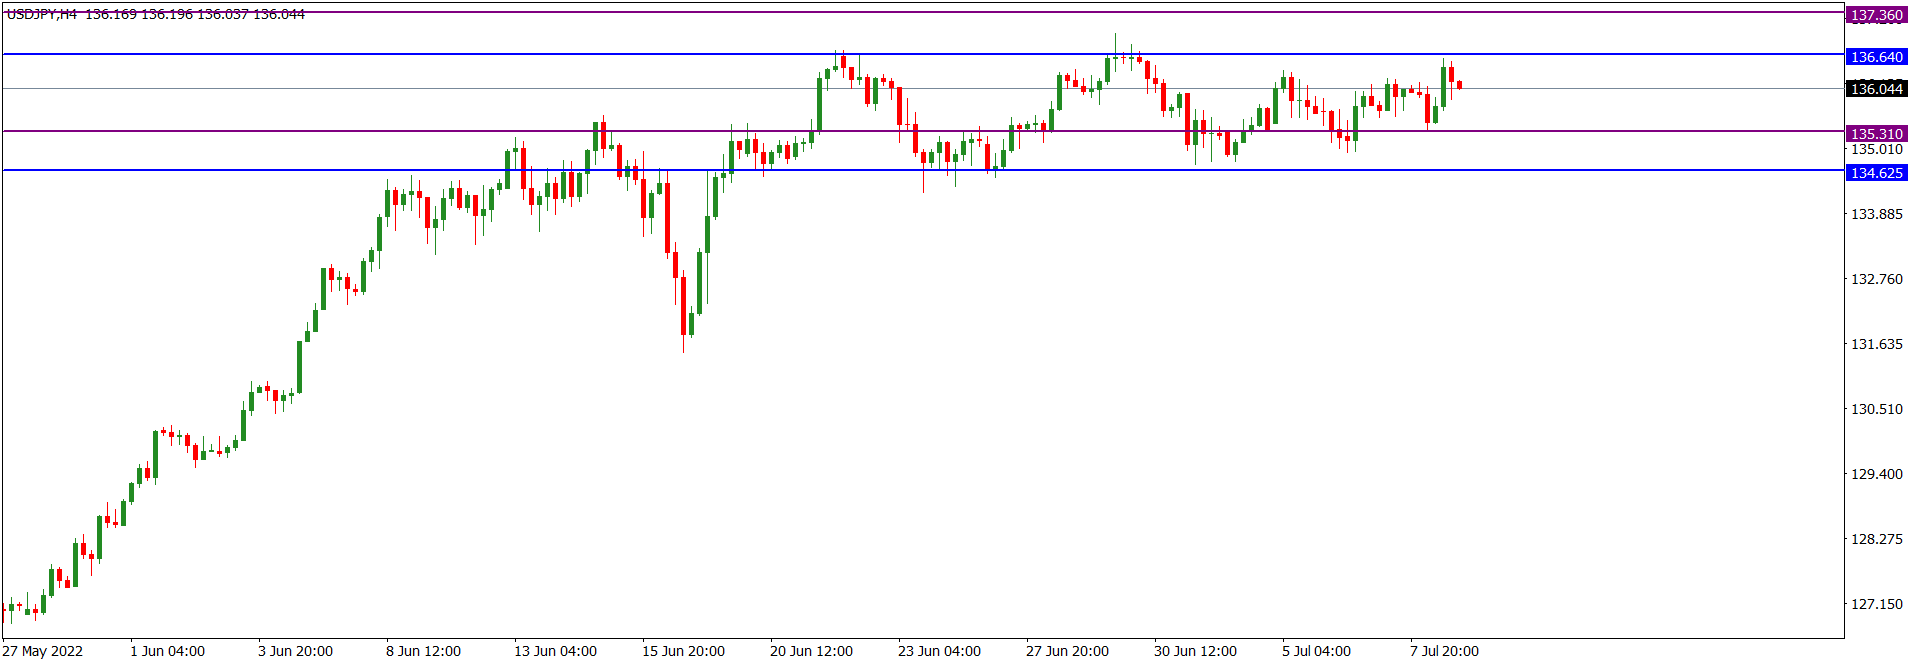
USDJPY price action on the H4 time frame is sideways in the 134.625/136.640 horizontal channel (blue). Although the technical structure favours bulls, a significant breakdown of the channel on a daily closing basis would trigger a bearish mode.
I may be wrong. Trade safe and prosper.
Trap
GBPUSD Weekly Technical Outlook
GBPUSD market operation on the weekly time frame is bearish. However, there is a decline in bearish momentum as price action tackles the 1.20780/1.19590 horizontal support zone (green). Last week, there was a bearish drive to below the zone, but a bullish pushback left a relatively prominent tail on the bearish candlestick that closed within the zone. We may see further bearish attempt to break down the zone.
GBPUSD price action on the daily time frame is in a bullish correction after a bearish drive to the 1.20780/1.19590 horizontal support zone (green) seen on the weekly time frame. Price action printed an indecision candlestick in the zone on Friday. However, the technical structure and order flow favour bears more than bulls, and we may see further bearish drive for market control. Therefore, any bullish move would be limited.
GBPUSD price action on the H4 time frame is in consolidation. There was a bearish drive to the 1.20780/1.19590 horizontal support zone (green) seen on the weekly time frame. But, as presently, a series of bullish corrective moves have not produced marked impact in the market, we may soon see a southward rotation.
I may be wrong. Trade safe and prosper.
Trap
EURUSD Weekly Technical Outlook
EURUSD market operation on the weekly time frame continues its bearish disposition. Last week, it broke down the 1.05210/1.03240 multi-year horizontal support zone (green) and then surged below the 1.01924 technical extension handle area (blue) before snapping back to close at the level.
EURUSD price action on the daily time frame is sideways at the technical support handle around the 1.01924 area (blue) after a bearish drive that broke down the 1.05210/1.03240 multi-year horizontal support zone (green). We may see bullish correction to a value area before further bearish drive. The 1.04330/1.04830 zone (red) is the operating daily supply.
EURUSD price action on the H4 time frame is in a bullish corrective mode. Further northward market engineering may target an area of liquidity or price imbalance before a southward rotation.
I may be wrong. Trade safe and prosper.
Trap
XAUUSD Weekly Technical Outlook
XAUUSD market operation is bearish. On the weekly time frame, last week, market operation printed a bearish continuation candlestick that surged towards the upper part of the 1697.170/1617.820 horizontal support zone (green). Although we may still see further bearish move, it is apparent that a bullish pullback is imminent.
The bearish drive of XAUUSD price action on the daily time frame is declining in momentum as price action attacks the 1697.170/1617.820 horizontal support zone (green) seen on the weekly time frame. The bearish surge to the upper boundary of the zone on Thursday did not have a follow-through as Friday’s price action printed a doji-like candlestick. Although we may still see further bearish move in the early part of this week, a bullish correction is in the offing.
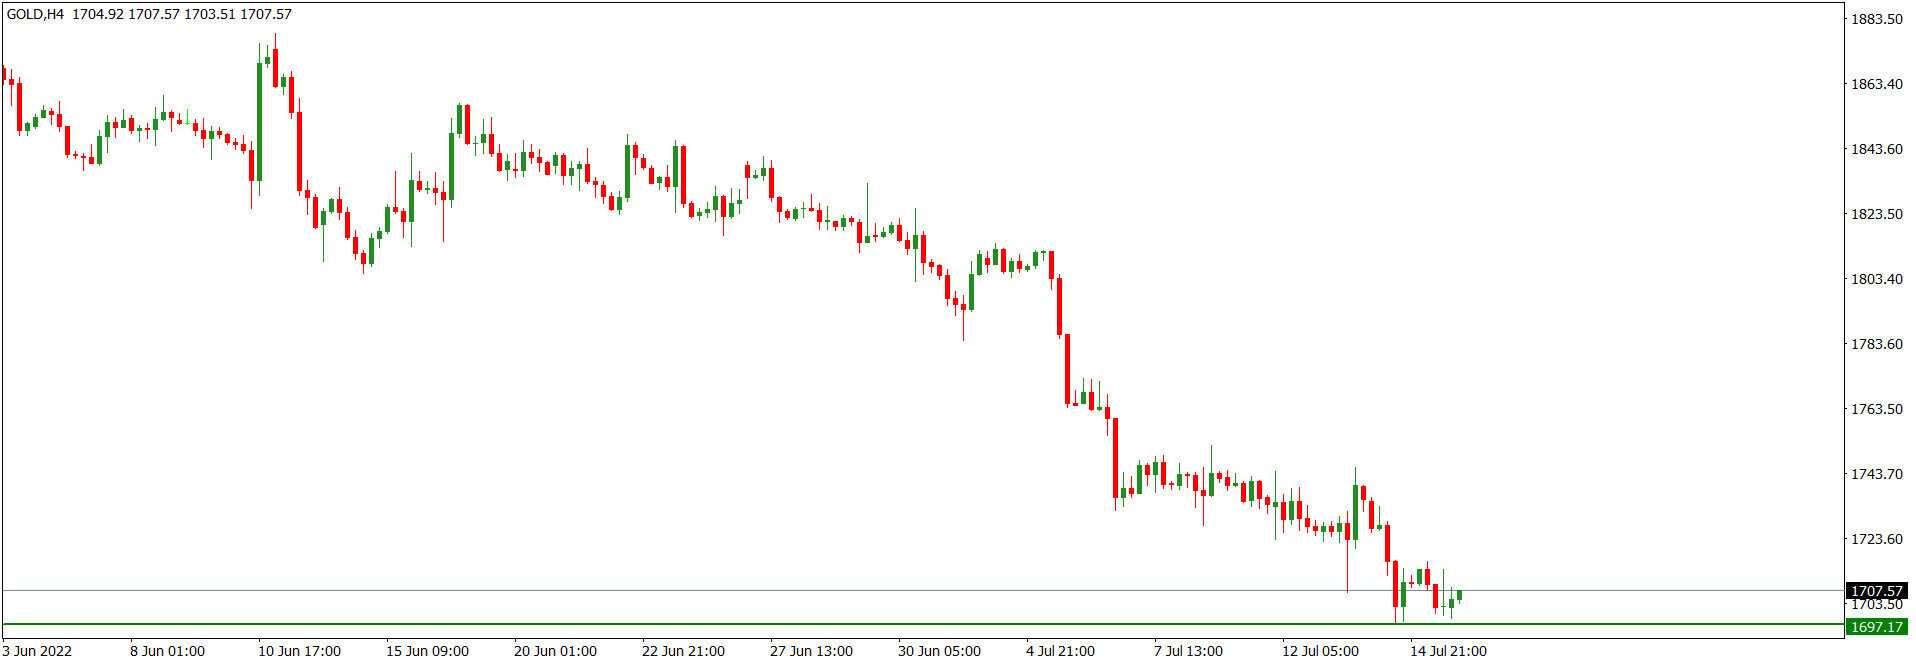
XAUUSD price action on the H4 time frame is sideways as it tackles the 1697.170 area (green), which is the upper boundary of the 1697.170/1617.820 horizontal support zone seen on the weekly time frame. Technically, price action is in a bearish environment, but we may soon see a bullish correction.
I may be wrong. Trade safe and prosper.
Trap
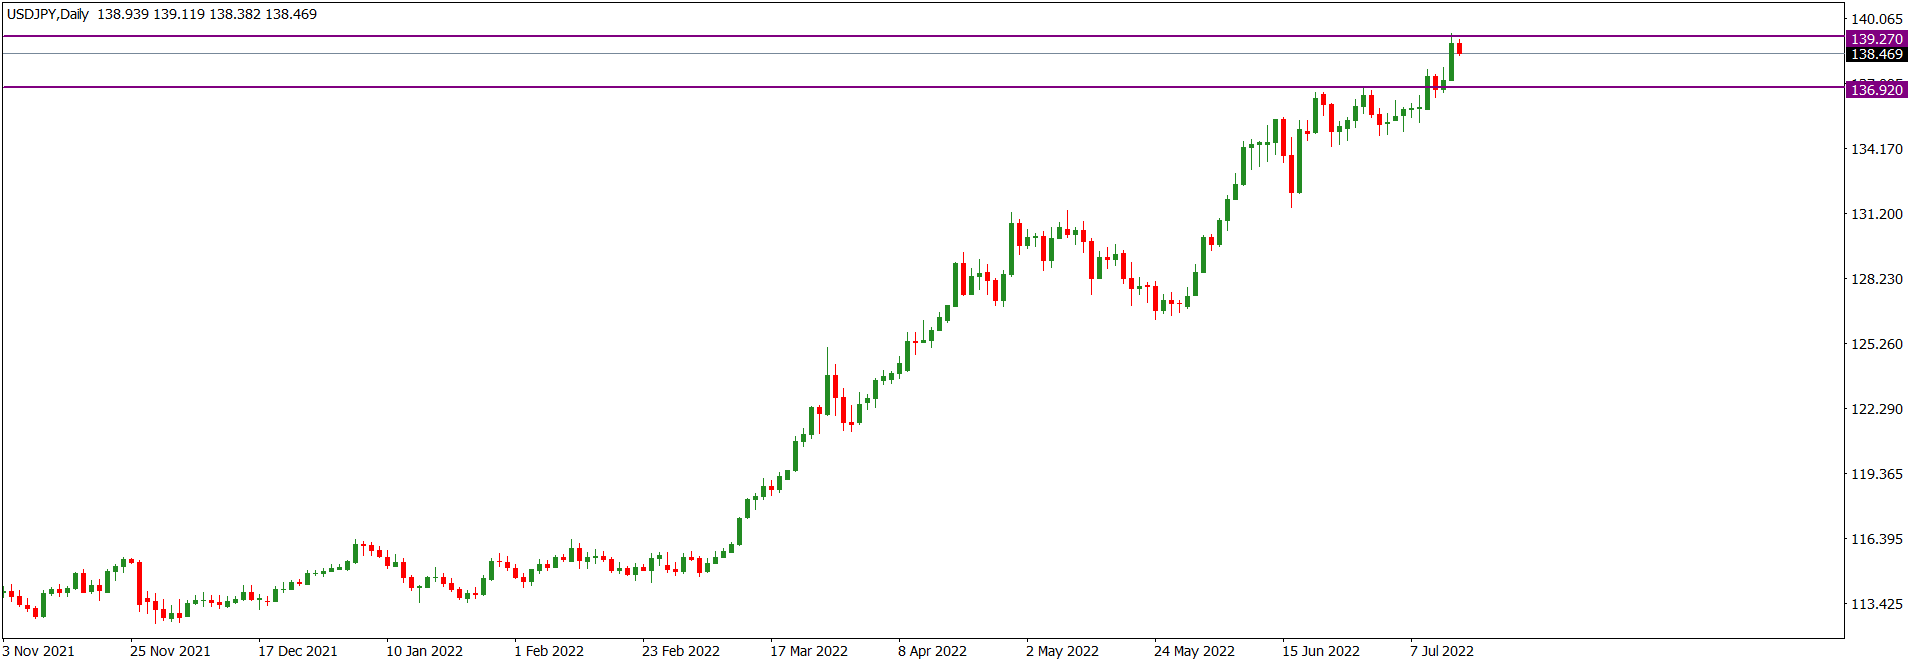
USDJPY Weekly Technical Outlook
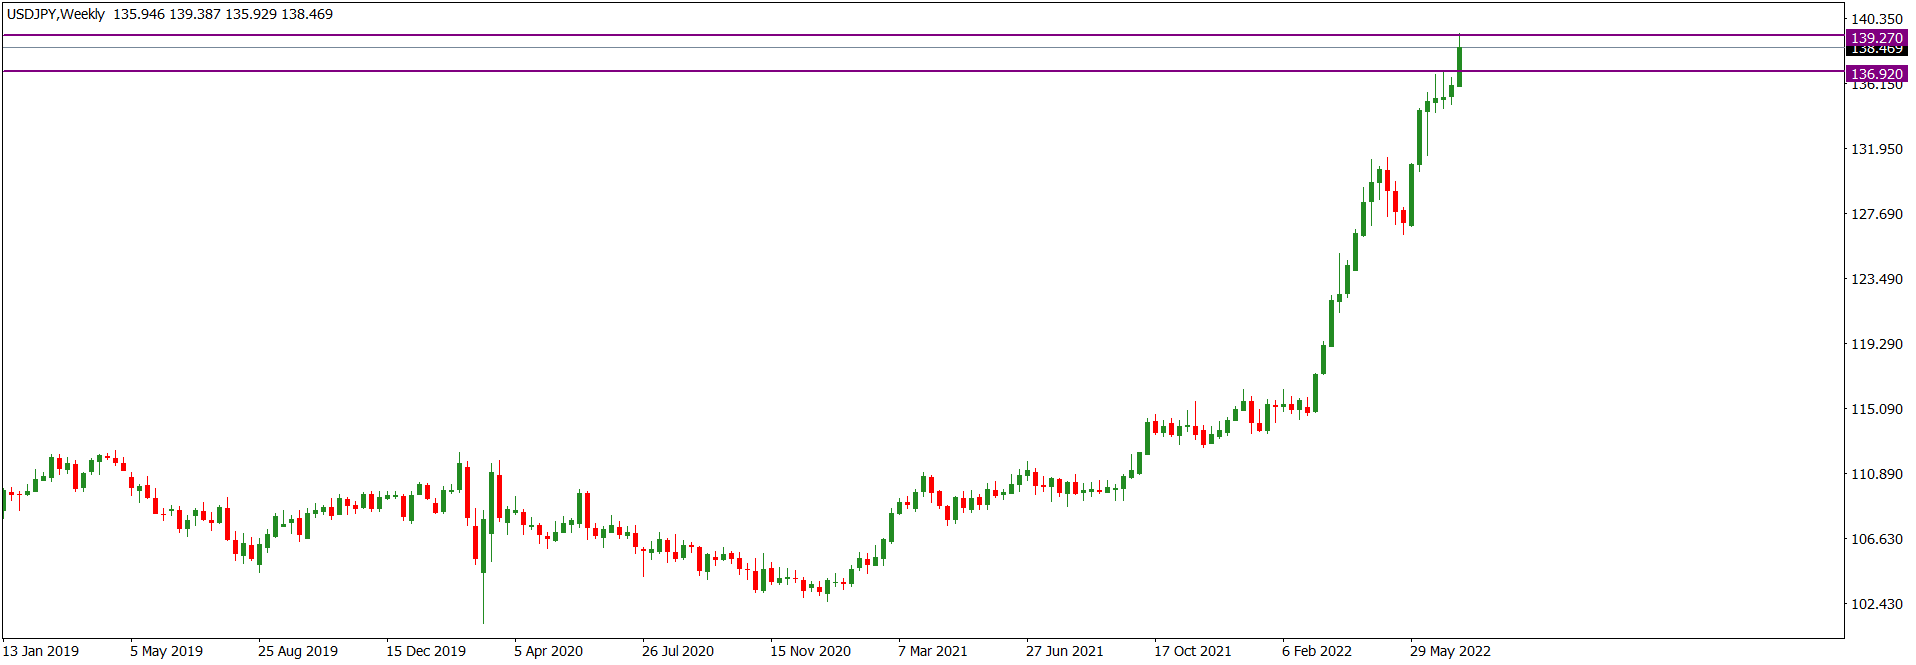
USDJPY market operation is bullish, but it is experiencing a decline in bullish momentum as it tackles the multi-year 136.920/139.270 horizontal resistance zone (purple). On the weekly time frame, last week, a relatively big bullish candlestick was printed in the zone. Until the last four weeks, the zone had not been visited since October 1998, and last week was the first time market operation closed within the zone. Meanwhile, bears are resisting the bullish attack on the zone, and this may hinder further bullish drive.
USDJPY price action on the daily time frame is tackling the multi-year 136.920/139.270 horizontal resistance zone (purple) seen on the weekly time frame. Although the technical structure is bullish, bears are resisting the bullish drive and, last week Friday, a relatively small bearish candlestick was printed in the zone. This portends the possibility of a bearish correction or a sideway of price action.
USDJPY price action on the H4 time frame is sideways in a technically bullish environment. As price action tackles the multi-year 136.920/139.270 horizontal resistance zone (purple) seen on the weekly time frame, we may see a bearish pullback. But this may not be sustained until a significant break down of the 136.920/139.270 horizontal resistance zone (purple).
I may be wrong. Trade safe and prosper.
Trap
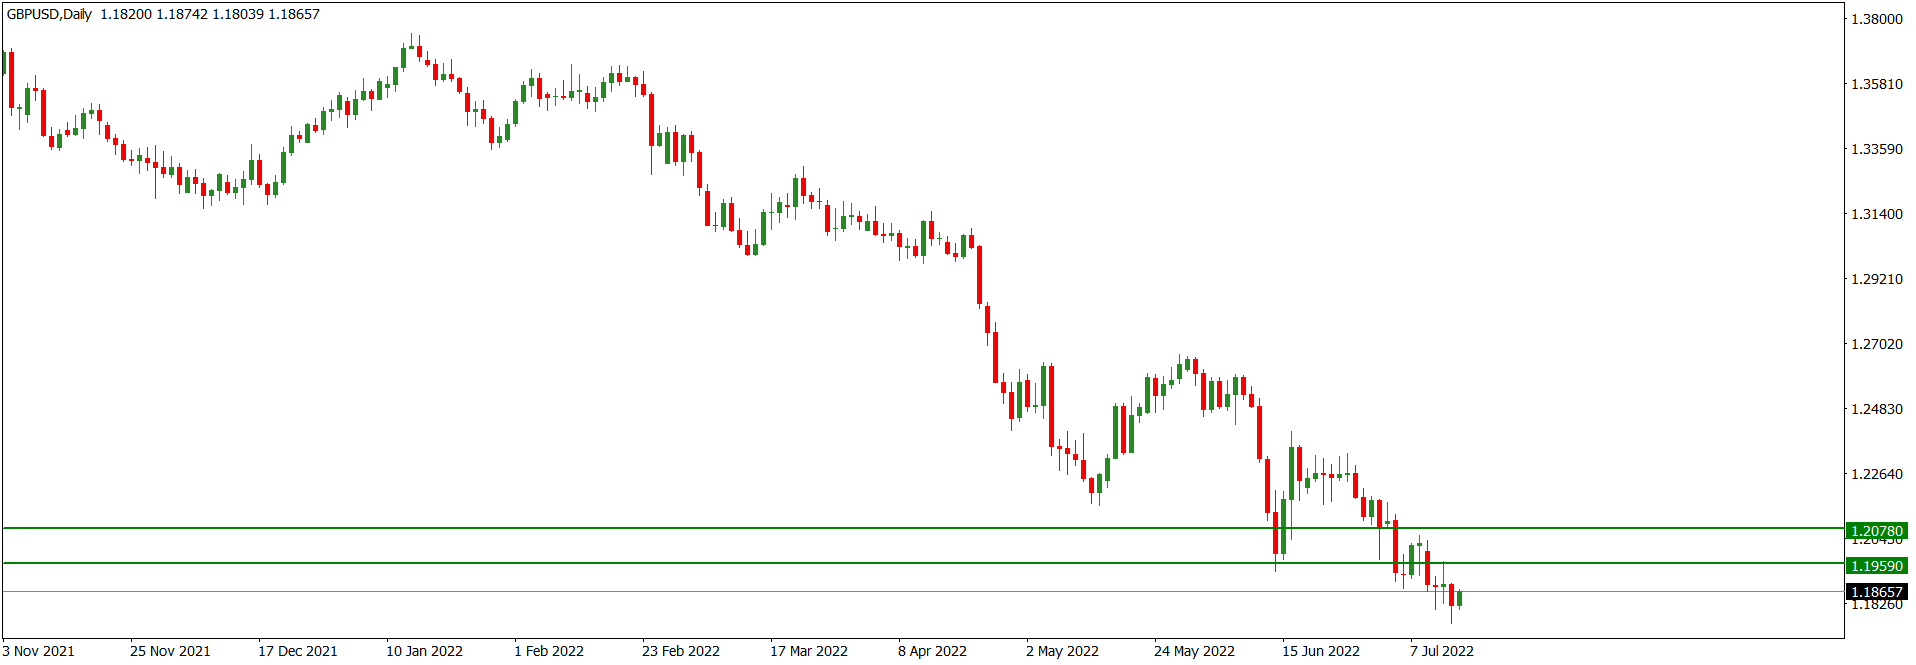
GBPUSD Weekly Technical Outlook
GBPUSD market operation is bearish. On the weekly time frame, last week, market operation broke down the long-term 1.20780/1.19590 horizontal support zone (green) after four incessant attacks on the zone. However, bulls are putting up a strong resistance and this may hinder the bearish drive.
GBPUSD price action on the daily time frame has turned sideways after breaking down the long-term 1.20780/1.19590 horizontal support zone (green) seen on the weekly time frame. We may see a corrective bullish move before a bearish continuation.
GBPUSD price action on the H4 time frame is in a bullish corrective mode in a technically bearish environment. We may see a bullish pullback to a value area, such as the 1.19890/1.20440 supply area (red), before a southward rotation.
I may be wrong. Trade safe and prosper.
Trap
EURUSD Weekly Technical Outlook
EURUSD market operation is bearish and tackling the long-term 1.02240/0.99856 horizontal support zone (green). On the weekly time frame, market operation surged to the zone two weeks ago and there was a bearish follow-up last week. However, bulls are resisting a breakdown of the zone, and this may hinder further bearish drive.
EURUSD price action on the daily time frame is sideways as it tackles the long-term 1.02240/0.99856 horizontal support zone (green) seen on the weekly time frame. As Friday’s price action printed a bullish candlestick, we may see further northward move before a southward turnaround. Besides, price action is around the support trendline of a falling channel (red) within which it is operating and may lead to a bullish retracement from the area.
EURUSD price action is tackling the long-term 1.02240/0.99856 horizontal support zone (green) seen on the weekly time frame, but it is in a bullish corrective mode on the H4 time frame. We may see further northward move before a southward turnaround.
I may be wrong. Trade safe and prosper.
Trap
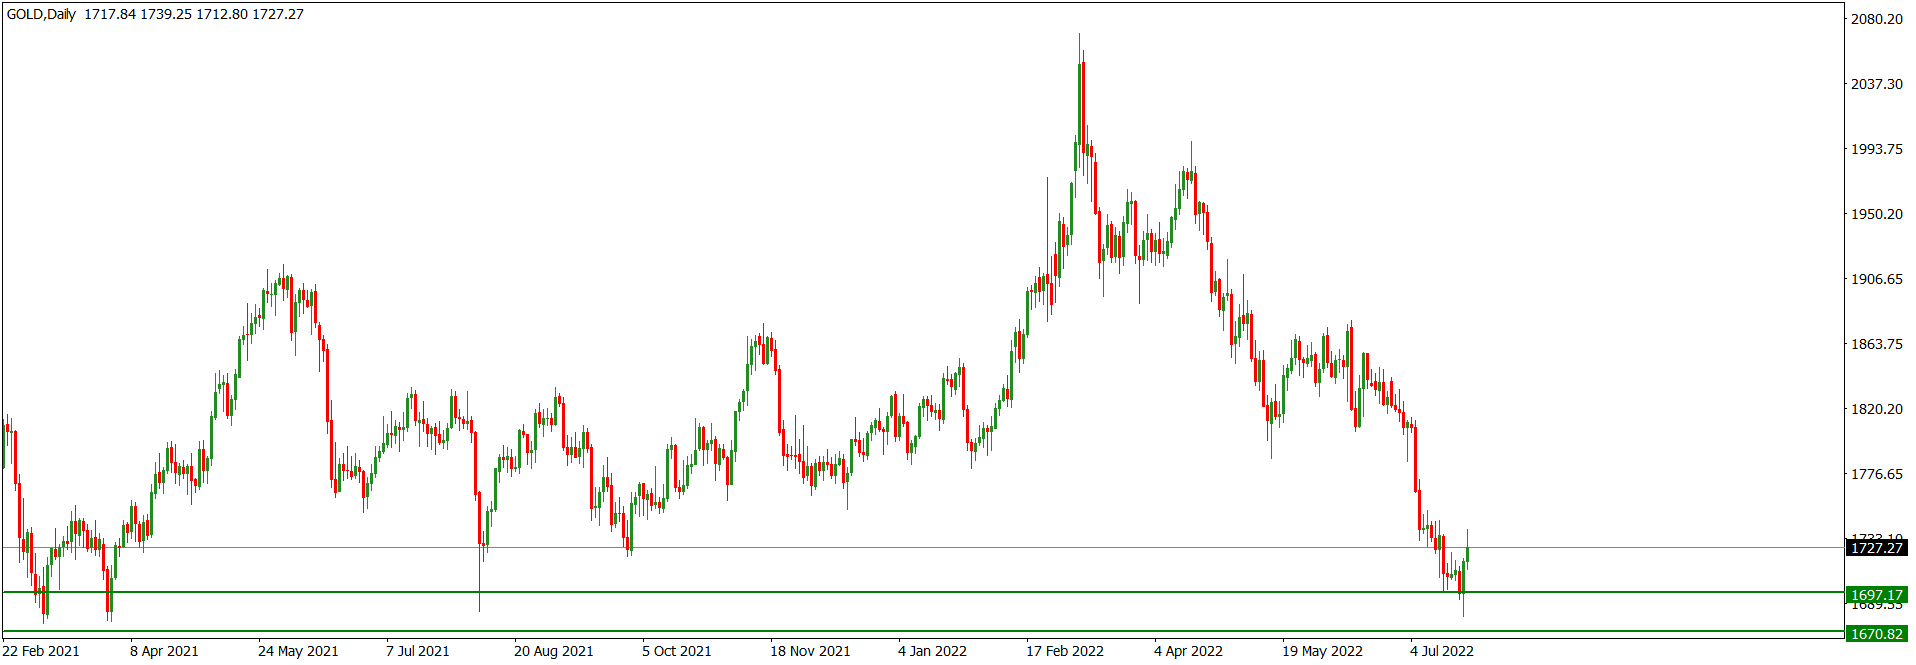
XAUUSD Weekly Technical Outlook
XAUUSD market operation on the weekly time frame surged into the 1697.17/1670.82 significant horizontal support zone (green) last week but rejected it with a bullish print. The last time market operation surged to the zone was in July 2021. However, the bullish pushback was weak, and we may still see a bearish retest of the zone.
The XAUUSD bearish drive to the 1697.17/1670.82 significant horizontal support zone (green) on the daily time frame is seeing a bullish pullback. Presently price action is at a nearby supply and a northward breach of the supply may see further northward market engineering for liquidity grab at an area of price imbalance. However, a bullish misstep may give way to a bearish turnaround.
XAUUSD price action on the H4 time frame is in a bullish retracement in the context of a bearish technical structure. Presently it is in a sideway mode, but we may still see further bullish move, perhaps for liquidity grab, before a southward turnaround.
I may be wrong. Trade safe and prosper.
Trap
USDJPY Weekly Technical Outlook
UDJPY market operation on the weekly time frame went sideways as it tackles the 136.920/139.270 multi-year horizontal resistance zone (purple). Two weeks ago there was a bullish drive into the zone but last week saw a bearish pushback that closed below it. Although the technical structure is bullish, we may still see further southward move to an area of value.
USDJPY price action on the daily time frame is in a bearish mode. Price action has retested the 136.920/139.270 multi-year horizontal resistance zone (purple) but met a bearish rejection. We may see further southward market engineering to an area of value before another strong bullish attempt to breach the zone.
USDJPY price action on the H4 time frame is in a bearish mode. Any further bearish drive may target the 134.480/133.590 horizontal support (green).
I may be wrong. Trade safe and prosper.
Trap