USDJPY Weekly Technical Outlook
USDJPY market operation is in a bullish technical structure. It made more than 61.8 Fib retracement of the 114.810/151.940 bullish swing and disposed northward. However, presently, it is sideways within the 134.940 horizontal resistance area.
USDJPY price action on the daily time frame is retesting the 134.140/138.400 horizontal resistance zone (red) and presently experiencing some bearish challenge. Although the dominant technical structure is bullish, we may still see southward liquidity engineering before further northward drive.
USDJPY price action on the H4 time frame is in a consolidation mode as it tackles the 134.140/138.400 horizontal resistance zone (red) seen on the daily time frame. The dominant technical structure is bullish.
I may be wrong. Trade safe and prosper.
Trap
EURUSD Weekly Technical Outlook
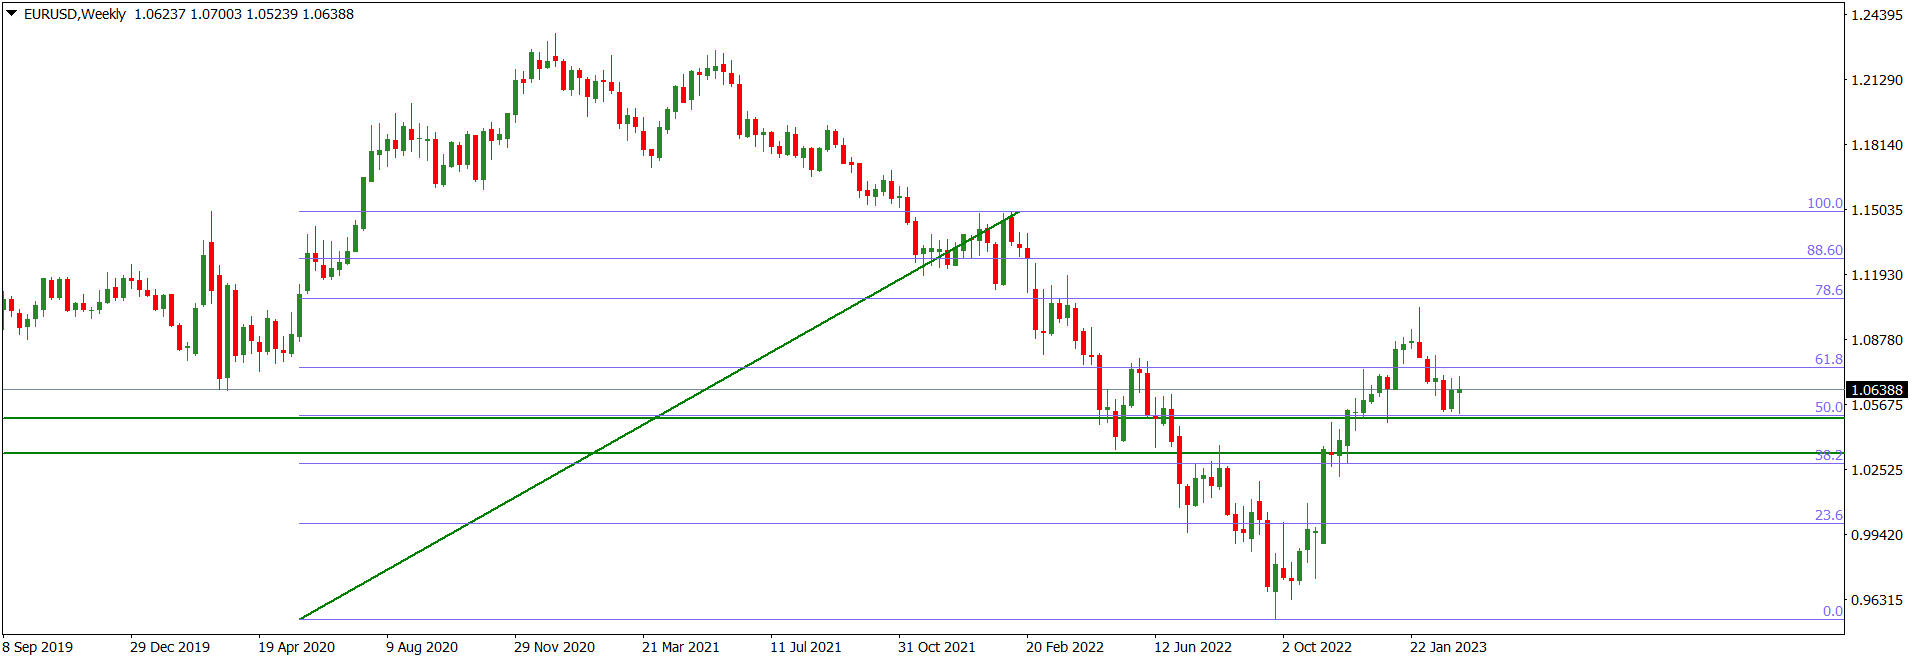
EURUSD market operation on the weekly time frame made a southward turnaround after the 61.8/78.6 Fib retracement of the 1.14940/0.95350 bearish swing. Presently, it is in a sideway mode as it printed an indecision candlestick last week.
EURUSD price action on the daily time frame made a 61.8/78.6 bullish correction of the 1.14940/0.95350 bearish trading range and turned southwards. Meanwhile, it is tackling a minor horizontal support area near the much more significant 1.05000/1.03310 horizontal support zone (green), and presently in consolidation. We may see a northward liquidity engineering before further southward drive.
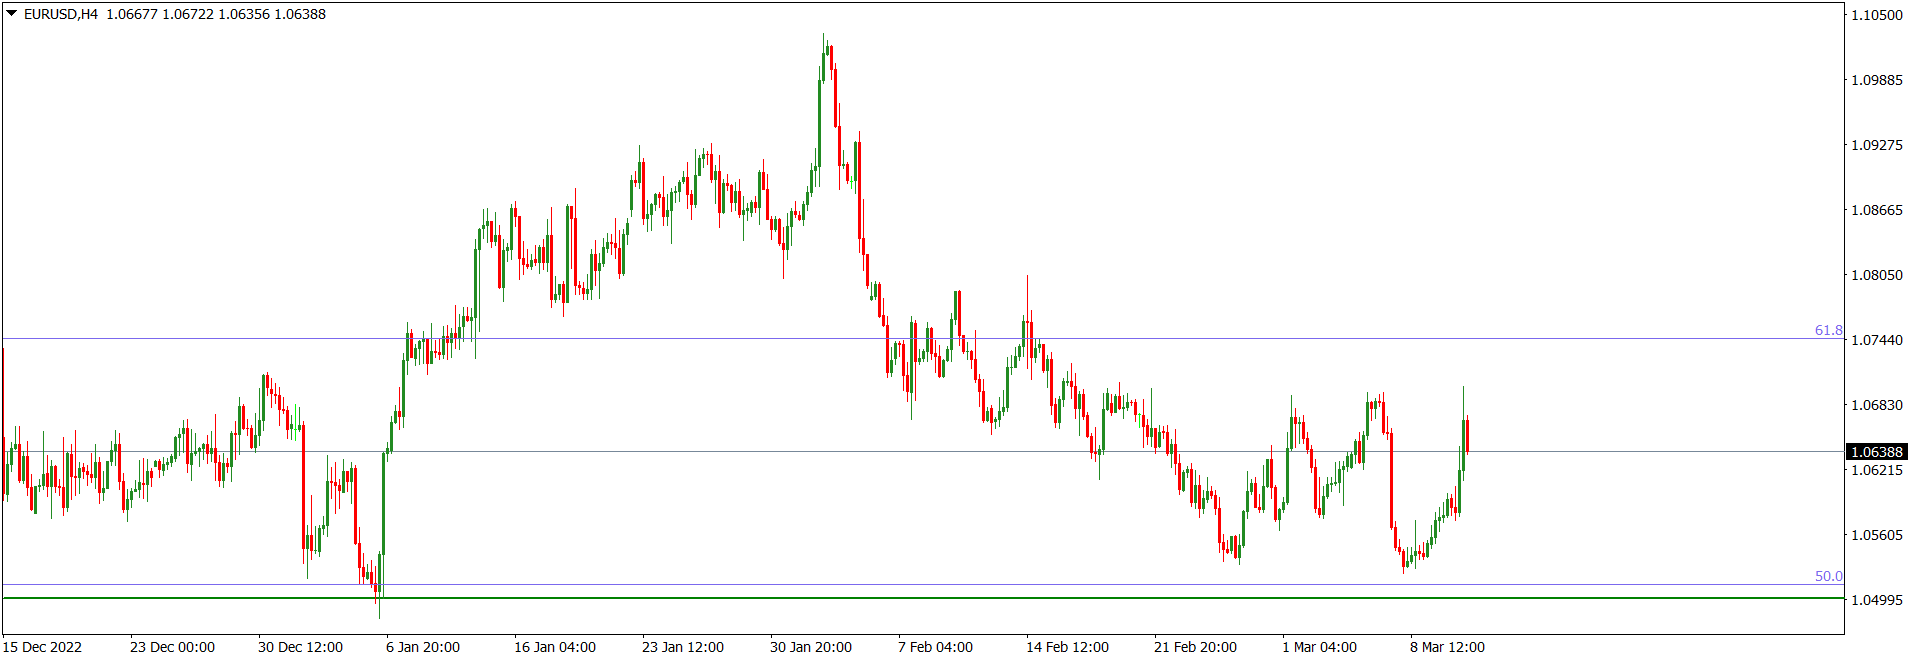
EURUSD price action on the H4 time frame is consolidating in a predominantly bearish technical structure.
I may be wrong. Trade safe and prosper.
Trap
GBPUSD Weekly Technical Outlook
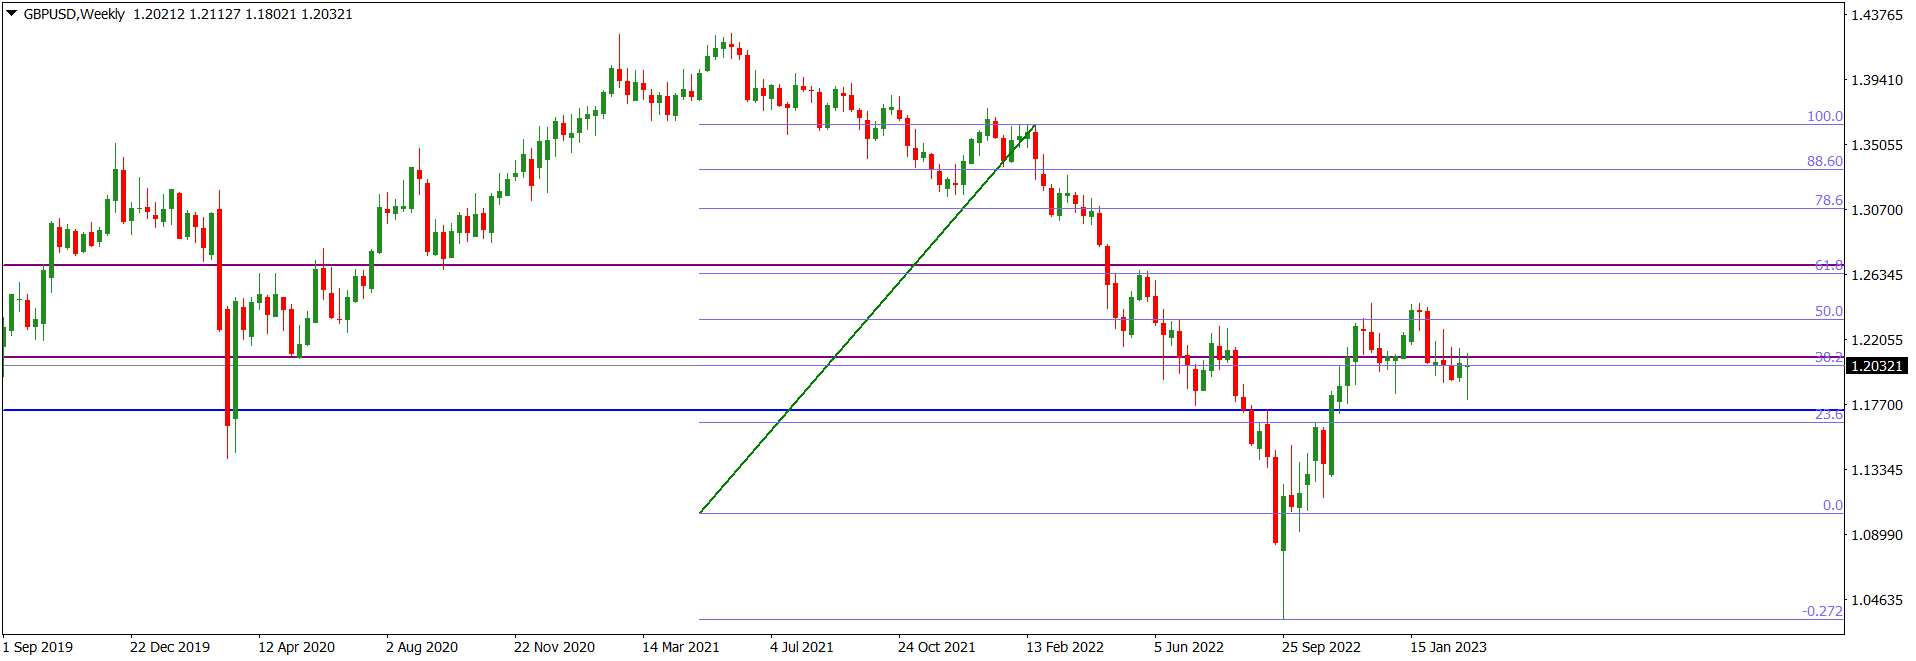
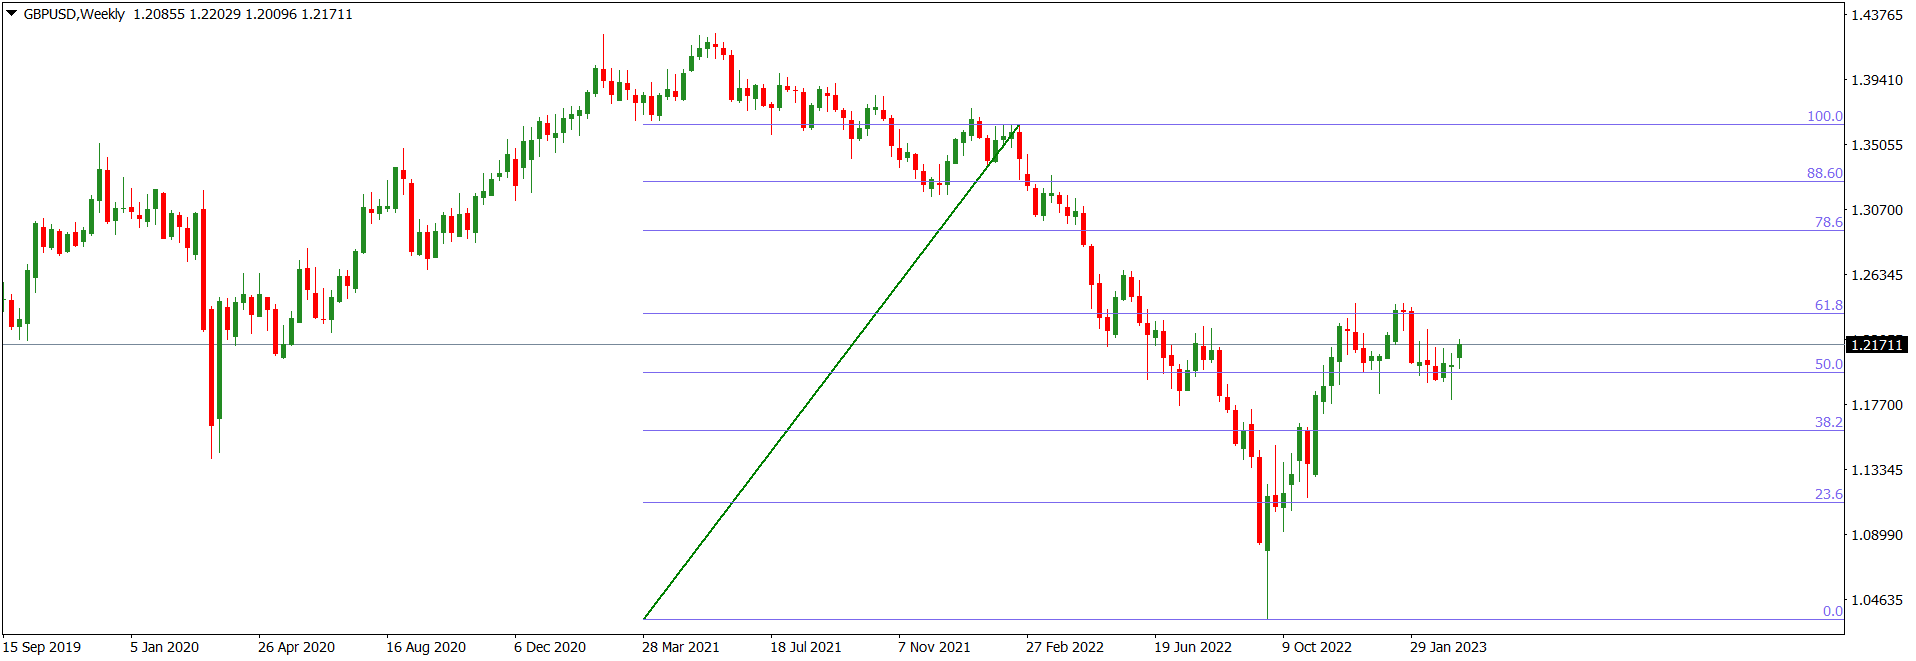
GBPUSD market operation on the weekly time frame is in a technically bearish structure. There was a bullish correction to the 50 Fib area a few weeks ago before a bearish drop to the 38.2 Fib area, where market operation has gone sideways.
GBPUSD price action on the daily time frame made 50 Fib bullish correction of the 1.36380/1.10540 bearish swing, and briefly turned southwards. Presently, it has turned sideways at the 38.2 Fib area and within the 1.20810/1.17300 horizontal support zone (blue). We may see bullish liquidity engineering before a southward drive.
GBPUSD price action on the H4 time frame is consolidating but the dominant technical structure is bearish. However, there are recent technical prints (e.g., ‘wicky tops’) that may incentivize northward liquidity engineering before a southward rotation.
I may be wrong. Trade safe and prosper.
Trap
XAUUSD Weekly Technical Outlook
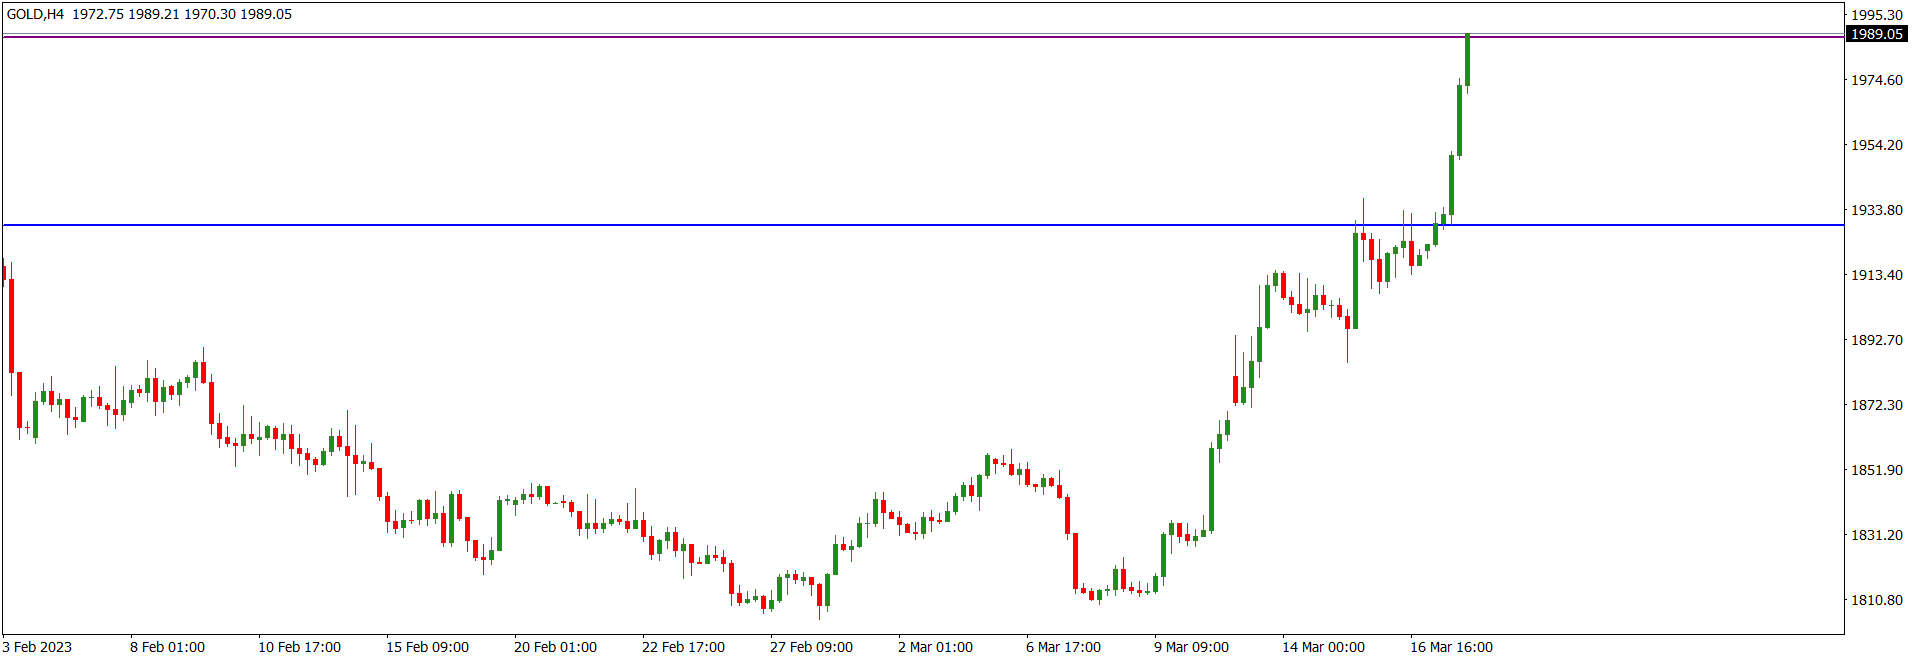
XAUUSD market operation on the weekly time frame punched through the 1928.670 horizontal resistance (blue) last week. The relatively big bullish candlestick printed last week is presently at the 1987.970 horizontal resistance (purple).
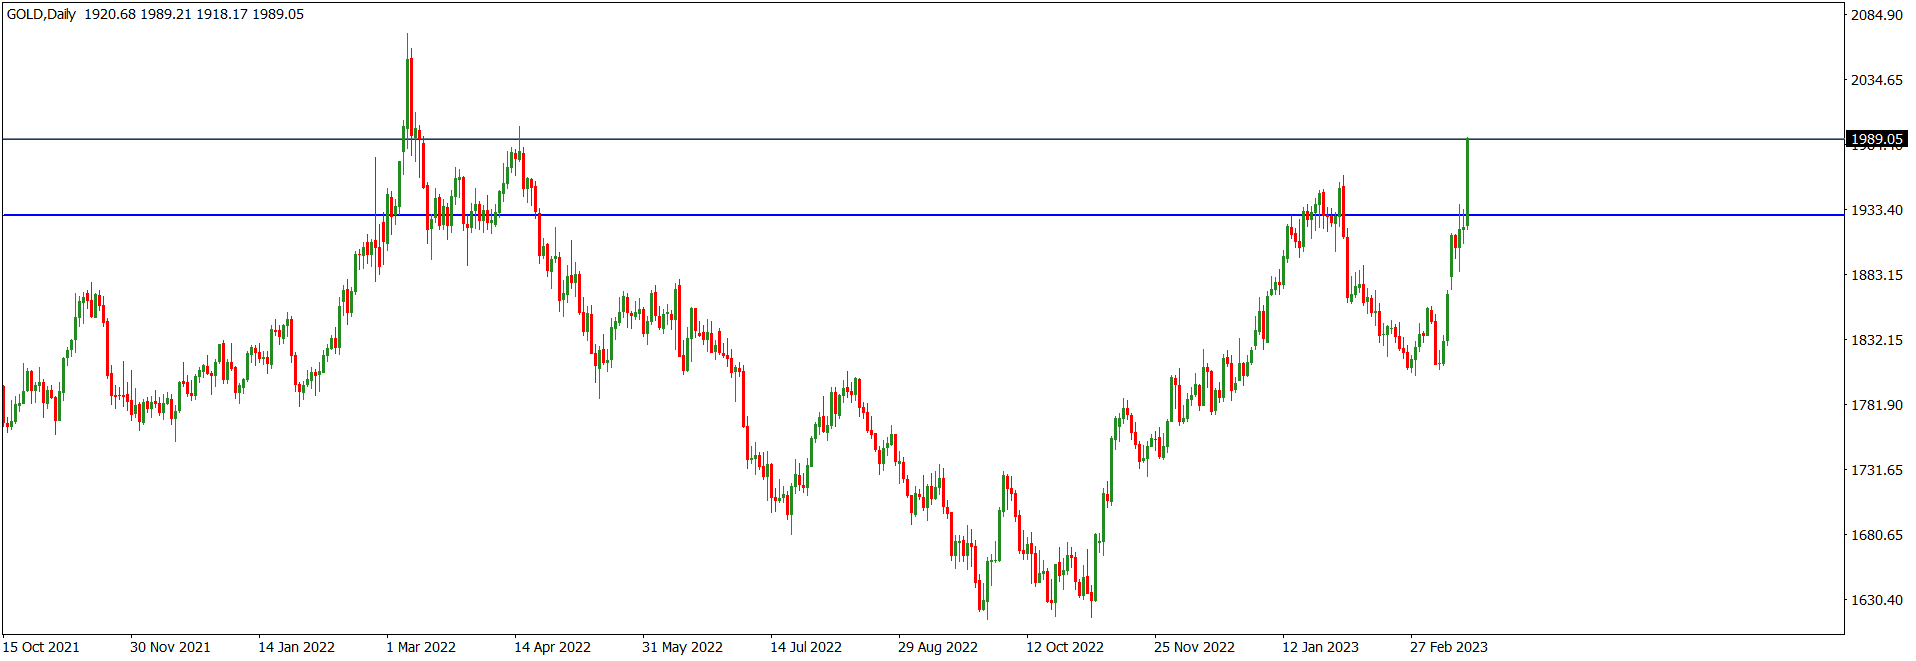
XAUUSD price action on the daily time frame is in a bullish mode. It is presently retesting the 1987.970 horizontal resistance area (purple) after a relatively strong bullish breakout on Friday. Although recent technical impulse supports bulls, we may soon see a bearish pullback or rotation after a northward liquidity charge.
XAUUSD price action on the H4 time frame is in a bullish mode. As recent price action is parabolic, we may soon see a bearish pullback.
I may be wrong. Trade safe and prosper.
Trap
USDJPY Weekly Technical Outlook
Two weeks ago, USDJPY market operation made a bearish rejection of the 135.740 horizontal resistance area (red). A bearish continuation print was issued last week, which is threatening the 130.980 horizontal support area (green). Technically, the 135.740/130.980 zone is a wide horizontal support zone as it aligns with a monthly horizontal support.
USDJPY price action on the daily time frame broke down the 133.120 horizontal support (blue) last week Friday. Any bearish follow-through in the early part of this week may see a retest of the 129.480 extension (SandyBrown).
USDJPY price action on the H4 time frame is in a bearish mode. Recent technical impulse supports further bearish move in the short term.
I may be wrong. Trade safe and prosper.
Trap
GBPUSD Weekly Technical Outlook
GBPUSD market operation on the weekly time frame is grinding out a bullish correction of the 1.36380/1.03340 bearish swing. Presently, it is tackling the 50/61.8 Fib retracement zone after a bearish drop from the 61.8 Fib area seven weeks ago.
GBPUSD price action on the daily time frame is making a bullish correction of the 1.36380/1.03340 bearish swing seen on the weekly time fame. It has been in consolidation within the 1.18220/1.24060 area (blue) for quite a while; an area which aligns with the 50/61.8 Fib retracement zone of the bearish trading range.
GBPUSD price action on the H4 time frame is in a bullish corrective mode within the 1.18220/1.24060 horizontal range (blue). We may still see further northward move towards the upper part of the range. However, the dominant technical structure is bearish.
I may be wrong. Trade safe and prosper.
Trap
EURUSD Weekly Technical Outlook
EURUSD market operation on the weekly time frame is sideways within the 50/61.8 Fib retracement zone of the 1.14940/1.095350 bearish swing having made a bearish rejection of the 78.6 Fib area seven weeks ago. The present location of market operation is also aligned with the 1.06770 horizontal resistance area, making it potentially susceptible to a southward turnaround.
EURUSD price action on the daily time frame is grinding out a bullish correction. It is presently sideways at the 1.06770 horizontal resistance area. This is an area within the 50/61.8 Fib retracement zone of the 1.14940/1.095350 bearish swing seen on the weekly time frame. Technically, such a location is susceptible to a bearish rotation.
EURUSD price action on the H4 time frame is in a sideway mode in the context of a dominant bearish trading range. The recent technical impulse favours bears.
I may be wrong. Trade safe and prosper.
Trap
XAUUSD Weekly Technical Outlook
Two weeks ago, XAUUSD market operation made a bullish drive to the 1987.980 horizontal resistance area (purple). Bears resisted the bullish charge and last week saw a strong pullback from the area. However, further bullish challenge resulted in the printing of a long doji-like candlestick that closed in the area. The 1928.670 area (blue) is the prevailing horizontal support and was threatened by the bearish surge to the area last week.
XAUUSD price action on the daily time frame is sideways at the 1987.980 horizontal resistance area (purple). As the1928.670/1987.980 zone represents a significant horizontal resistance zone on the monthly time frame, we may still see some bearish operation in the zone.
XAUUSD price action on the H4 time frame is tackling the 1987.980 horizontal resistance area (purple) but lacks directional momentum. There have been mixed candlestick prints in the area recently, and the candlestick printed in the last H4 session on Friday was doji-like.
I may be wrong. Trade safe and prosper.
Trap
USDJPY Weekly Technical Outlook
USDJPY market operation on the weekly time frame is in a bearish mode. Presently, it is tackling the 130.980/128.905 horizontal support zone (green) where it is seeing some bullish challenge.
USDJPY price action on the daily time frame is bearish but presently in a sideway mode at the upper part of the 130.980/128.905 horizontal support zone (green) seen on the weekly time frame. When we look left, recent technical pattern offers the likelihood of further liquidity engineering southwards, perhaps to the lower part of the zone.
USDJPY price action on the H4 time frame is issuing a bullish correction; the technical structure favours bears more than bulls. We may see a southward turnaround after a northward liquidity engineering to an area of value such as the 131.680/132.200 area (blue).
I may be wrong. Trade safe and prosper.
Trap
GBPUSD Weekly Technical Outlook
Last week, GBPUSD bullish market operation on the weekly time frame met a strong bearish challenge as it attempted a 61.8 Fib retracement of the 1.36380/1.03340 bearish swing, an area which also align with the prevailing horizontal resistance. We should also be mindful of the fact that the market operation has been confined to the 1.18220/1.24060 horizontal channel (blue) since mid-November 2022, and a bearish disposition within the channel may be in the offing.
GBPUSD price action on the daily time frame is sideways at the upper part of the wide 1.18220/1.24060 horizontal channel (blue). There was a bullish retest of the 1.24060/1.22680 daily supply on Wednesday which resulted in a bearish pushback on Friday. Nevertheless, we may still see northward liquidity engineering before a southward rotation.
GBPUSD price action on the H4 time frame is in a bullish corrective phase but presently seeing a bearish pushback. Nevertheless, we cannot discount northward liquidity engineering in the early part of this week.
I may be wrong. Trade safe and prosper.
Trap
EURUSD Weekly Technical Outlook
Last week, EURUSD bullish market operation on the weekly time frame met a strong bearish challenge as it attempted a 61.8/78.6 Fib zonal retracement of the 1.14940/0.95350 bearish swing. Although we may still see northward market engineering to an area of value, the technical structure is bearish.
EURUSD price action on the daily time frame has turned sideways as it retests the 1.07580 horizontal support. As the dominant technical structure is bearish, any northward liquidity engineering would be corrective in nature. A bearish rotation may target the 1.05200 handle (blue).
EURUSD technical impulse on the H4 time frame is bearish but the price action is in a corrective mode. Any bullish drive would give way to a bearish rotation, which may expose the 1.05200 area.
I may be wrong. Trade safe and prosper.
Trap
EURUSD Weekly Technical Outlook
The last three months have seen EURUSD market operation constrained within the 1.05200/1.08500 horizontal channel (blue). In March, EURUSD market operation closed at the upper boundary of the channel, which was a positive move that opposed the bearish drive to the lower boundary of the channel in February.
Last week, EURUSD market operation on the weekly time frame made a retest of the 50 Fib retracement of the 1.22535/0.95350 bearish swing. Technically, the last seventeen weeks have seen market operation confined to the 1.05200/1.08500 horizontal channel (blue)., which aligns with the 38.2/50 Fib zone. This is indicative of a relatively strong resistance zone.
EURUSD price action on the daily time frame made a bullish retest of the upper boundary of the 1.05200/1.08500 horizontal channel (blue) and went sideways. Although we cannot rule out further northward liquidity engineering, the dominant technical structure is bearish.
I may be wrong. Trade safe and prosper.
Trap
GBPUSD Weekly Technical Outlook
The last four months have seen GBPUSD market operation constrained within the 1.18220/1.24060 horizontal channel (blue). In March, GBPUSD market operation closed at the upper boundary of the channel, which was a positive move that opposed the bearish drive to the lower boundary of the channel in February.
Last week, GBPUSD market operation on the weekly time frame made a retest of the 61.8 Fib retracement of the 1.36380/1.03340 bearish swing. Technically, the last nineteen weeks have seen market operation confined to the 1.18220/1.24060 horizontal channel (blue), which spans the 50/61.8 Fib zone; a confluence which indicates a relatively strong resistance zone.
GBPUSD price action on the daily time frame has been confined to the 1.18220/1.24060 horizontal channel (blue) since November 16, 2022. In the last few days of last week, price action went sideways at the upper part of the zone. Although we cannot rule out further northward price action, the dominant technical structure is bearish.
I may be wrong. Trade safe and prosper.
Trap
USDJPY Weekly Technical Outlook
USDJPY market operation on the weekly time frame has turned sideways after a bullish rejection of the 130.980/128.230 horizonal support zone (green). The bearish candlestick printed last week had a relatively moderate tail, indicating that bulls are resisting the bearish pushback.
On the daily time frame, USDJPY price action is challenging the bearish attack of the 130.980/128.230 horizonal support zone (green), seen on the weekly time frame. There was a bullish rejection of the zone on February 23, but bears have been making a persistent attack on the zone since March 20. Recent technical prints with low wicks (bottom tails) may incentivize a southward liquidity sweep before any further bullish momentum. And for those tracking XAUUSD, this portends further northward move of XAUUSD price action before a southward rotation.
Recent technical impulse of USDJPY price action on the H4 time frame favours bears more than bulls. But as price action is tackling the 130.980/128.230 horizonal support zone (green), seen on the weekly time frame, we may soon see increased bullish pressure.
I may be wrong. Trade safe and prosper.
Trap
EURUSD Weekly Technical Outlook
EURUSD market operation last week lacked directional momentum. It is still finding it difficult to break above the 50 Fib retracement of the 1.22535/0.95350 bearish swing after three weeks of bullish charge. The area is within the 1.08500/1.09690 horizontal resistance zone (purple), which, technically, is a zone that could yield a strong bearish pushback.
EURUSD price action on the daily time frame remains sideways as it tackles the 1.08500/1.09690 horizontal resistance zone (purple), seen on the weekly time frame. Technically, the zone is susceptible to a strong bearish pushback as it aligns with the 50 Fib retracement area of the 1.22535/0.95350 bearish swing and price action has failed to break above the zone after many days of tackling the zone.
EURUSD price action on the H4 time frame has been confined within a rising wedge (magenta) but the dominant technical structure is bearish. Besides, price action is presently located in the 1.08500/1.09690 zone (purple), which is a technically strong horizontal resistance zone.
I may be wrong. Trade safe and prosper.
Trap
GBPUSD Weekly Technical Outlook
Since the last week in November 2022, GBPUSD market operation has made three strong bullish charges at the 1.24060 horizontal resistance area (purple) without breaking it. The area aligns with the 61.8 Fib retracement area of the 1.36380/1.03340 bearish swing. Last week’s bullish charge at the area met a bearish pushback.
On Tuesday, GBPUSD price action on the daily time frame broke above the 1.24060 horizontal resistance area (purple), the first time since 16 June 2022, before a bearish pushback that started on Wednesday. The bullish charge of Tuesday may incentivize further bullish attempt this week, but as the area is a technically strong horizontal resistance and aligns with the 61.8 Fib retracement area of the 1.36380/1.03340 bearish swing, we may not see much bullish drive.
On Tuesday, GBPUSD price action on the H4 time frame made a brief bullish breakout from the 1.24060 horizontal resistance area (purple), seen on the weekly time frame, but turned bearish on Wednesday. Presently, price action is sideways around the area, but we cannot rule out further northward liquidity engineering before a southward rotation. The dominant technical structure is bearish.
I may be wrong. Trade safe and prosper.
Trap
XAUUSD Weekly Technical Outlook
Last week, XAUUSD market operation on the weekly time frame retested the 2033.100/2049.870 horizontal resistance zone (purple), technically leaving the 1968.640/1950.590 zone (green) as the operating horizontal support. As last week’s bullish candlestick left a relatively long upper shadow and closed below the previous week’s bullish close, we cannot rule out further bearish pressure this week.
XAUUSD price action on the daily time frame is in a bearish mode. Friday’s bearish print was a rejection of the 2033.100/2049.870 horizontal resistance zone (purple), and bearishly engulfed Thursday’s bullish print. We can expect a bearish follow-up in the early part of this week.
XAUUSD price action on the H4 time frame is bearish. Further southward move could target the 1976.700 minor horizontal support, if not the major 1968.640/1950.590 zone (green) seen on the weekly time frame.
I may be wrong. Trade safe and prosper.
Trap
USDJPY Weekly Technical Outlook
USDJPY market operation on the weekly time frame turned sideways after a bearish retest of the 130.980/129.530 horizontal support zone (green) two weeks ago. Last week saw a limited northward push to challenge the bearish move of the previous week but, presently, market operation is tackling a horizontal resistance at the 133.770 area.
Although USDJPY price action on the daily time frame is sideways, recent technical impulse is favorably bullish. But price action is tackling a minor horizontal resistance at the 133.770 area.
USDJPY price action on the H4 time frame is tackling the horizontal resistance at the 133.770 area but the technical impulse is still in favour of bulls.
I may be wrong. Trade safe and prosper.
Trap
GBPUSD Weekly Technical Outlook
GBPUSD market operation on the weekly time frame has failed to breach the 1.24060 horizontal resistance area (purple) after several attempts that began in the last week of November 2022. The area coincides with the 61.8 Fib retracement of the 1.36380/1.11550 bearish swing. Presently, market operation is sideways in the area and last week’s market operation printed an ambivalent candlestick in the area.
GBPUSD price action on the daily tie frame is struggling to significantly break above the 1.24060 horizontal resistance area (purple) seen on the weekly time frame as a bearish engulfing print on Friday neutralized the bullish charge of the previous two days to retest the 1.24060 line. The area aligns with the 61.8 Fib retracement of the 1.36380/1.11550 bearish swing. Further bearish move in the early part of this week cannot be ruled out.
Recent technical impulse of GBPUSD price action on the H4 time frame favours bears. Technically, bearish price action is retesting the 1.24060 area after a brief bullish break out.
I may be wrong. Trade safe and prosper.
Trap
EURUSD Weekly Technical Outlook
EURUSD market operation is disposed northwards. On the weekly time frame, it broke above the 1.08500 area, which is the lower level of the 1.08500/1.09690 horizontal resistance zone (purple). Last week’s market operation printed a bullish candlestick which closed just at the upper part of the zone. Technically, EURUSD market operation is still at the 50 Fib retracement area of the 1.22535/0.95350 bearish swing.
EURUSD price action on the daily time frame is tackling the 50 Fib retracement area of the 1.22535/0.95350 bearish swing. Although there was a bullish move above the 1.08500/1.09690 horizontal resistance zone (purple) on Thursday, bears neutralized the move Friday. So, presently, EURUSD price action on the daily time frame is in a sideway mode.
Recent EURUSD price action on the H4 time frame is seeing an increase in bullish prints. But the bearish pressure in the last two H4 sessions on Friday hindered bullish momentum to effectively breach the 1.08500/1.09690 horizontal resistance zone (purple).
I may be wrong. Trade safe and prosper.
Trap