EW, Gartleys, Fibos, and market timing

Well here comes a fun interesting part.

We want to ride the trade for as much as possible, and we have to be patient and not desperate! Give time to your trade to mature!, get away from the computer for several hours and don’t start analysing too much the market! You’ll get contradictory signals and more than likely you’re going to cut your profits!

There are many ways of trailing your stops and you have to be discretionary as the market unfolds and tells you what it is doing. The trick here is not to use profit targets, but let the market take us out when conditions are no longer in our favor.

Once in the trade you’re going to trail your stops once a new swing develops and price resumes in you favor. So yes, you have to let price go against you for a while in order to complete a swing, but you have to be confident of the analisys that led you to the trade, and confident that the overall trend will be in your favor.

You can use the slow stochs to confirm the new swing.

Ok here’s where Elliot Wave takes an important place again.

Since we’re expecting a new 5 wave impulse movement to take place you can add positions on signs of the start of wave 3 are shown.

You can also tight your stop losses on signs of the completion of a wave 5 arises.

Another good technique to tight your stops is to identify possible congestion patterns (flags, pennants) and trail the stops right below them, just in case they brake against us.

You could also take close attention to important support/resistance zones, fib levels, etc.

Trust me it takes courage, and patience, and more patience, and cold thinking but it definitelly pays off.

Ok this puts and end to the theory (Finally!) :smiley:

This is not absolute of course, everyone takes what suits them, modify some things a little, and incorporate what they already know.

Lately this is what trading is about! Finding what suits us the most, and more importantly, what makes us profitable! :slight_smile:

Time to start trading!

I have on my radar this Eur/gbp bearish gartley. D is at .8943, a long way still left, but overall I like the structure, and the timing, later on I’ll make more time analisys on this pair depending on how it develops.

Right now I’m looking for fullish patterns emerging in the small timeframes (with all the same characteristics, Ew, fibs, etc) to trade all the way up to D, if possible.

This could be an opportunity to go long up to the completion of the previous 8hr pattern…

So far it looks good.

Wrtm,

Thanks for all your hard work, it’s most appreciated.

What do you think of this? Price seems to have bounced off last night’s (aqua) gartley. I removed the fibs for clarity, but there was strong convergence.

My count is probably wrong and horribly over simplified, so to all you EW experts out there, be gentle, I’m a rookie. But please feel free to correct me, I’m here to learn.

Hey Modo, glad you drop in.

Honestly that one has taken a lot of time to develop, and soon will exceed the maximun allowed and it’s not even close in price.

I’d say that it had already started a new rally down. Who knows.

I’d take it with this other perspective, but I don’t know more of Ew than 12345, so no expert at all here either. Just my 2 cents.

And taking a look at the bigger picture, I’d say that probably we’re about to start Subwave 3 of wave 3.

yeah, i see what you mean, thanks for the help.

Never mind :wink:

I just took a look at it and it didn’t even reached the short term D and it’s dropping again.

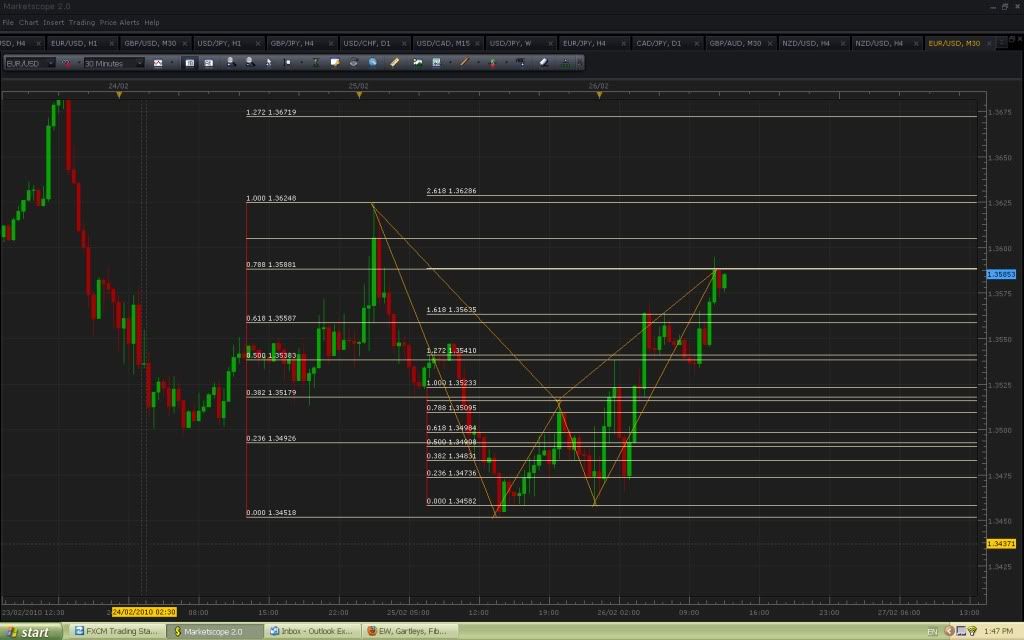
30 min chart.

I’m liking this one so far.

I’ve been able to project the last swing time cycle and it could be completed within two hour more or less.

You can see price and time projections signaled with the two blue lines.

A really small timeframe, I know, but it’s being considered in the context of a bigger structure.

When the time comes I’ll take a decision. :slight_smile:

Well it turns out that it worked in time, but not in price, lol.

Even though we had a resistance convergence at 61.8%, that wasn’t the ideal one, but market does what it’s supposed to do and ignored my call on the 78.6% XA fib convergence. :smiley:

Well time to reasess a possible completion of the expected D, or definitely wait for another set up. Time will tell, no rush.

Well market retraced way too soon, and I didn’t trade it, but this real time example works to graphically explain what I wanted to say with the theory part.

We had pattern, time, we just missed price, but even so price reacted to one of our fib levels, so price was aligned too, just not in the ideal level.

It also shows the beauty of Elliot wave identifying the position of the market, in this case a short term up trend within a major downtrend, which we could expect to resume at 0.8943.

Wouldn’t be a bad idea to be able to trade the last impulse up, if the opportunity shows up.

Another opportunity to graphically explain one way of trailing your stops and let your profits run.

You can trail your stops every new swing presented on the pair. You can use any oscilator of your preference to confirm what you see in price.

Trail your stop one pip below/above your swing.

I marked the swings in price and oscilator with the green horizontal lines. :slight_smile:

Seems like there will be some opportunites to trade fractals.

Pairs I’m currently looking at, aussie, kiwi, and some yen crosses.

Still a long way there, and some are developing fast, but I think it’s worth taking a look at them.

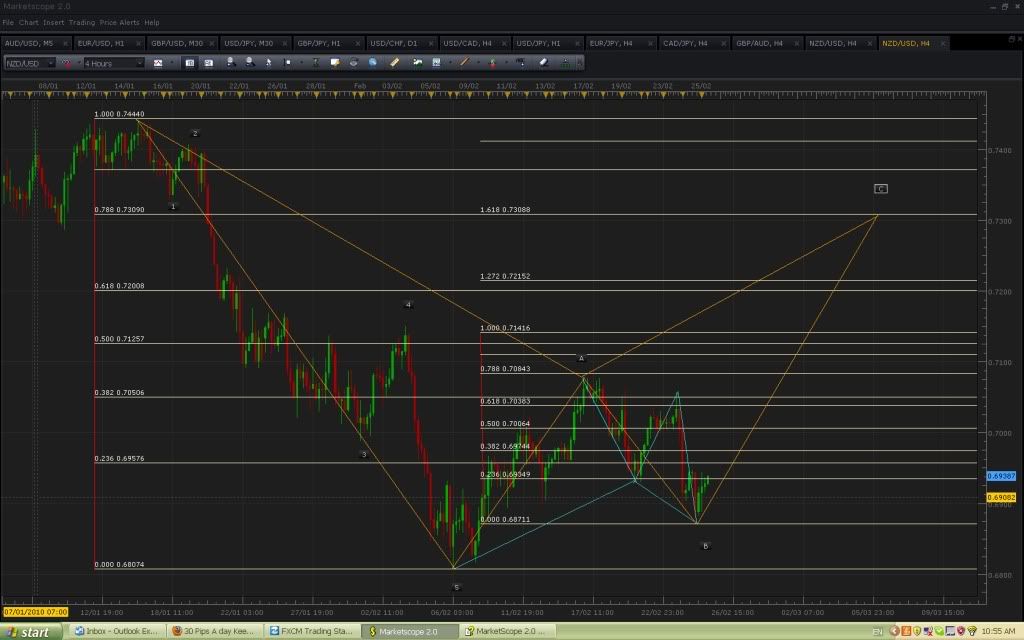
Here’s my aussie chart.

Hi Wrtm,

Any thoughts on this? Maybe my X is not valid, and I don’t have the time/horizontal fib function, so I’d be interested in your thoughts.

Thanks
Modo.

Actually, nevermind, I’ve gone cold on it for a number of reasons. Sorry to bother you.

Hey Modo,

Sorry for the late reply, although convergence looks good, I don’t see any other element to give weight to this pattern.

Regarding time it has already exceeded the maximum time limit.

Hope that helps. :slight_smile:

cool mate, thanks

Currently in this trade, and it’s keeping me holding my breath, lol.

You can see the chart that I posted a few days ago for reference, and now this, the current chart.

Reasons to take the trade.

  • Probable end of wave C
  • Major downtrend.
  • Fib convergences.
  • Pattern developed after the 31.8% time extension of XA and D is exactly and the 100% time projection of AB.

Since it’s a 8hr/daily pattern I’m using a stop loss of 40 pips, which now that I think it better it’s kind of tight, but I’m not able to risk more pips. I already distributed my two percent risk in those 40 pips.

Price has not reacted as I’d wished to convergence, but it’s a major pattern and price is showing signals of being overbought.

Let’s see how it goes. :eek:

Also took this trade that posted yesterday.

Pattern developed nicely, and D was reached exactly at the 150% fib time extension of AB.

There’s a higher D, but this particular one looks like could present good resistance.

Currently at breakeven .