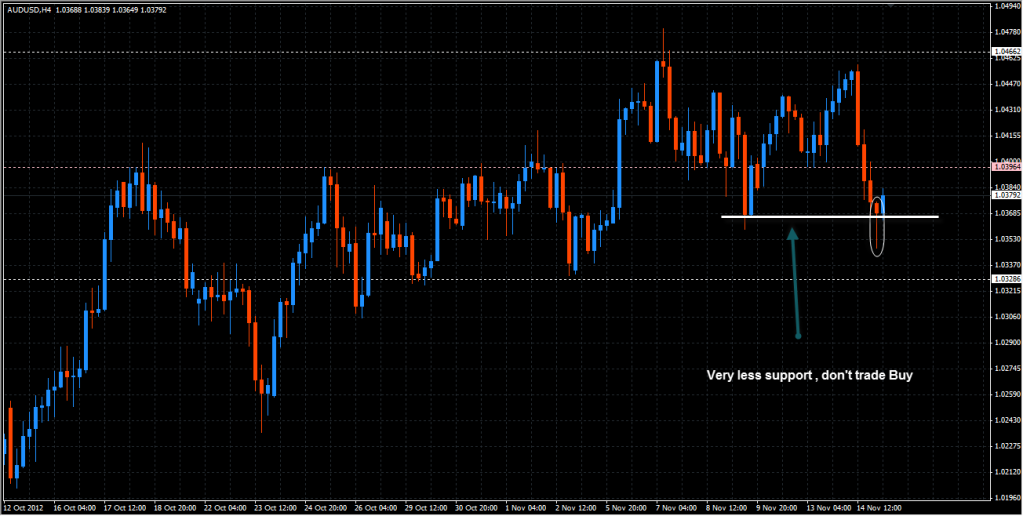
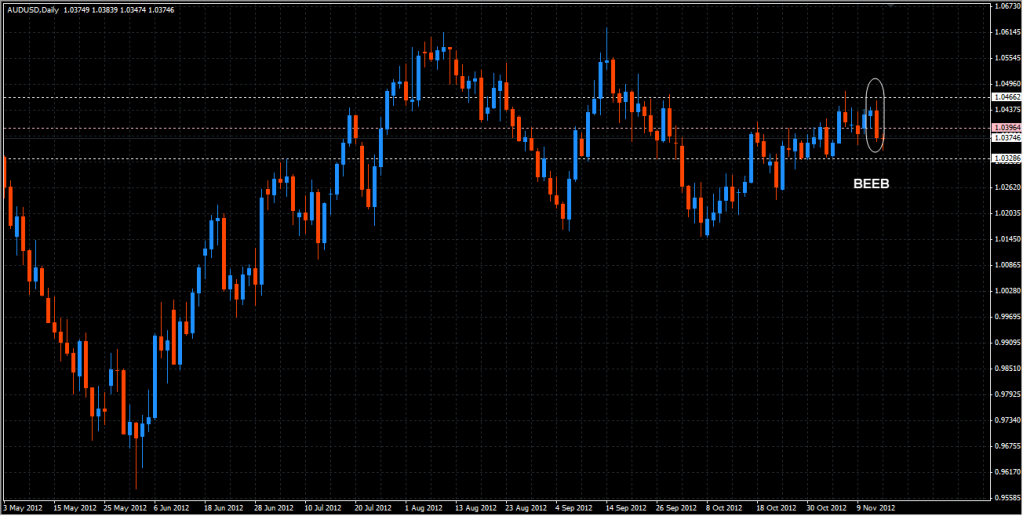
Thats a tuff call there it would have to show me something pretty impressive. For now I would still be looking to get long on this pair. But if that resistance does hold Things could get quite interesting as price would have made a lower low and a lower high. However we have been stuck in a range for quite some time now something has to give soon.
Actually your chart is zoomed to me. Mine looks like this.
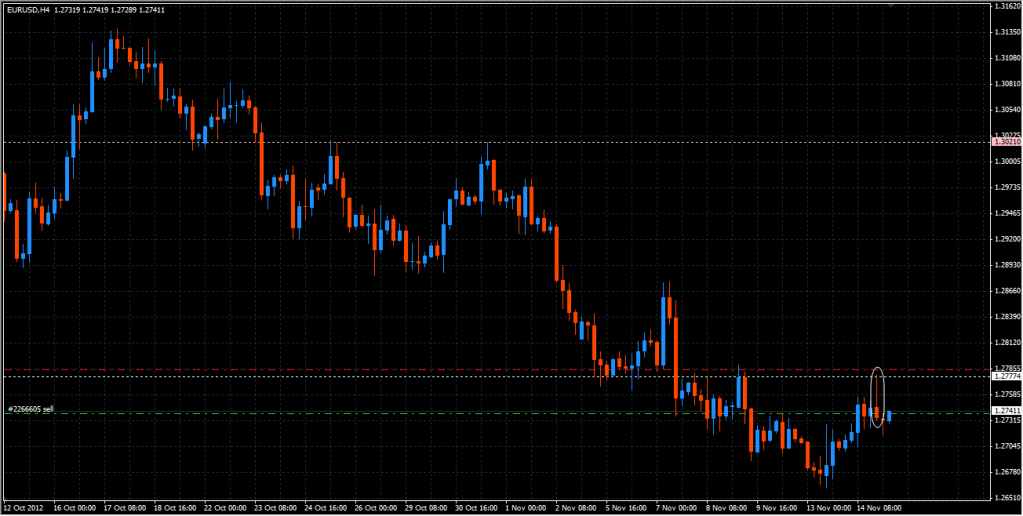
As for entering, I entered on anyhow, with a small SL (33 pips). Looks sure thing to me. Even if it is not, my loss won’t be big. The real thing I’m watching is the break below 1.2660. I’ll decide to exit or continue at that level.
Hi Metin,
I am guessing that you have used the H1 chart for your signal to enter… Personally, I am sticking with H4 & Daily at this stage of my learning. Trades on the shorter T/Frames mean that I will have to watch my screens too long. Also, from what I have read throughout this thread, it seems that the H1 & shorter charts can be very jumpy with a lot more false breaks etc.
Just my 2 cents - good luck with your trade buddy. Hopefully I will join your Short very soon but my entry will be based on what I see at current bar close. :44::22:
Thanks Spongy - The Boss beat me to it but yep - I sure am . After 6 -7 years of Indicator Cr-p, I was still going nowhere real fast.! Found Johnathon’s PA thread here on B/Pips which showed me the way to FSO. Jeepers - it was here in front of me all the time . I just did not know what I was supposed to be looking at. Thanks to Johnathon , you, Dudest etc ( sorry if I missed some out), I am finally starting to see what PRICE ACTION is telling me. So Much to Learn - So Little Time (LOL ):p:45::35:
Hi Meadsie,
Usually I don’t trade on H1 timeframe. But I have been waiting for a big fall on EURUSD for a couple of days and honestly I was surprised at EUR pairs today making a big move upwards. The pinbar on H4 (even though not closed yet) seemed to be a sign of continuation and H1 TF accompanying this view kinda confirmed my opinion.
Otherwise you’re right, H1 time frame produces many false signals but like I said, this is what I’d been expecting for days (not Price Action wise, but other kind of analysis warned me on a big fall on EURUSD).
Congratulations All - Page 500
:54:
Absolutely monster thread and no sign of the nonsense that ruins so may others. Congrats Jonathon and long may it continue!
EUR/JPY 4hr worth consideration… ( unable to post charts at present). We have 2 Doji’s and possibly a third forming at the 200 ma and at a zone of previous support/ resistance. The pair has also broken its recent up trend and has failed thus far to retest that upward trend line. A bearish engulfing candle closing below 10200 would see me take a short position.
EUR/CAD is an interesting one… On the daily the down move could be viewed as a pullback in the larger upward trend. But more interestingly on the 4hr chart it may well be failing at the 12800 level, which has been reliable support and resistance since September ( sorry again I cannot post charts). The 200 SMA is currently containing the price action and the move on the 4hr chart is currently resisting at the 38.2% fib. My personal view of this pair is bearish, which I am using other crosses such as the EUR/USD and EUR/JPY to paint such a picture. I am now looking for a bearish engulfing candle or a number of Dojis to fail around the 12800 to go short. Interestingly the AUD/CAD looks poised for a pullback, which supports some technical CAD strength.
Gidday MT2,
Thought I would post what I am seeing on the EuroYen for you. I too would be waiting for a decent break of that 102.00 to see if short was likely here. Otherwise I prefer the Euro crosses with the Pound & Dollar as per my screen shots. Seem to be better bars from my view. What do you reckon buddy ? :53:
Meadsie, good spot on EUR/GBP! It’s failed at the 200ma on the 4hr chart and is hovering around the 38% retracement. However if you look at the high (4hr) on 9october, lows of 24 October and high of 31 October you can draw a downward sloping trend line. This coincides ith a 50% retracement from the major down trend and is powerful in itself! If we see a reversal candle during the next bar I may be tempted but otherwise I will open a decent short having seen a reversal formation at the 50% retracement/ downward sloping trend line around 8060
Hi guys. I’ve just started learning PA trading, and seriously, look at the attachments below. All these beautiful pin bars formed at the SAME TIME!! The only chart I’m unsure of is the NZD/USD 4hr chart, as it seems after the previous pin bar was formed, now it is forming another pin bar which might bring the candles to be bullish. What are your views?
I am really struggling to find a technical reason to short the EUR/USD at the moment, yes it’s in a down trend but not making any significant pullbacks or reversals to warrant a position. My bias is most certainly bearish and I find the cci 20 very useful to indicate overbought in down trends. At the moment the EUR/USD has its CCI over bought on the 4hr chart and you will see how previous ones that go with the trend play out. If we see a bearish engulfing candle I am tempted to take a small position.
Cheers
I think one of the most valuable price action trading method is to make sure everything confirmed before you shot the target.
If you unsure, just don’t waste your bullet. Market is always there.
[QUOTE=LeonMiyavia;420342]Hi guys.:chart I’m unsure of is the NZD/USD 4hr chart, as it seems after the previous pin bar was formed, now it is forming another pin bar which might bring the candles to be bullish. What are your views?
Hi there Leon,
Great that you are joining in here. Just a couple of things though - Can you resize your charts as it is pretty hard to identify the latest ( & Most Important ) Price Action. I am not too sure if you are using New York close bars which is pretty much a requirement on this thread so that we are all looking at the same thing.
It is recommended reading the 1st 50 pages of this thread. Johnathon covers everything you might need there.
Just ask if you need help.
In response to your question on the NZD/USD H4 - The bar you refer to as a PinBar is not actually a PinBar.
The strict definition of a good PB is that it must be large enough to stand out from the crowd , it should have a nose that is at least 3 x the real body and it must close within the preceeding bar. Recent momentum is strongly Bearish and I would need an exceptional PA signal to consider any Long trade. In fact I will be watching now for a continuation down then a re-trace back to test recent Support now possible Resistance and try and enter Short.
Hope this makes sense mate. :eek::54:
Notice this pair just now. Newbies here. Any comment on this pair?sorry for the short form.
Should be double pair of bearish engulfing bar. Daily chart
is it because that pin bar made a lower low?
My broker is Oanda. The closing time for daily chart bar is 0000 hour North America.


