No worries friend. Page 1 and then the first 50 pages of this thread have much of the info you need to begin.
Re watching pairs, Johno has said he watches lot’s of pairs and a few other markets, with the theory being the more pairs you are watching, you can then ‘cherry pick’ the best setups to trade instead of potentially trying to force a trade that isn’t there like we might if only watching a few pairs.
Keep posting your idea’s. The senior traders here, and all of us can offer feedback.
Hi Matko. I am looking for short PA on EUR/AUD off that level too.
Thanks guys, now I see that I could have drawn up better S/R levels.
Yeah I started to read the first pages of this topic, then switched to the original FSO website and continued with that, but I try to keep a balance between the two.
I’ve read a lot in this thread and I really like PA, but H1 H4 Daily is way too slow for me. I haven’t seen anyone ask about lower timeframe than H1, has anyone tried trading on M15 and maybe draw the support lines on H1? If so, how is it going and what are your thoughts on that?
Most people that use scalping do use 15,5,1 minute time frames , but this thread focuses on longer term trades, in which case larger time frames are needed, they only thing some traders do is use the 15 or 5 time frame to pull the trigger. Take care eywede.
Im still practicing on Demo no harm done. Im just gaining more experience
Trade on USD/CAD counter trend did not work out . I say you’re right on the oil
Hey gforce , Why did you take a buy position here ? I dont see any valid signals that would give you a buy and also like PippinItOldSchool said bout that flipzone. High probability that it will cause damage cause I’ve been there so many times lol
Right on Joey. Thanks. I zoomed out chart and i see what you mean. And this is what it’s all about for me. Rolling the sleeves up, posting charts and learning through doing.
Hey Baojie. Thanks. Yes you are right. The signal is a BUEB on 4H. I didn’t look far enough to the left. Still, let’s see if it pushes through.
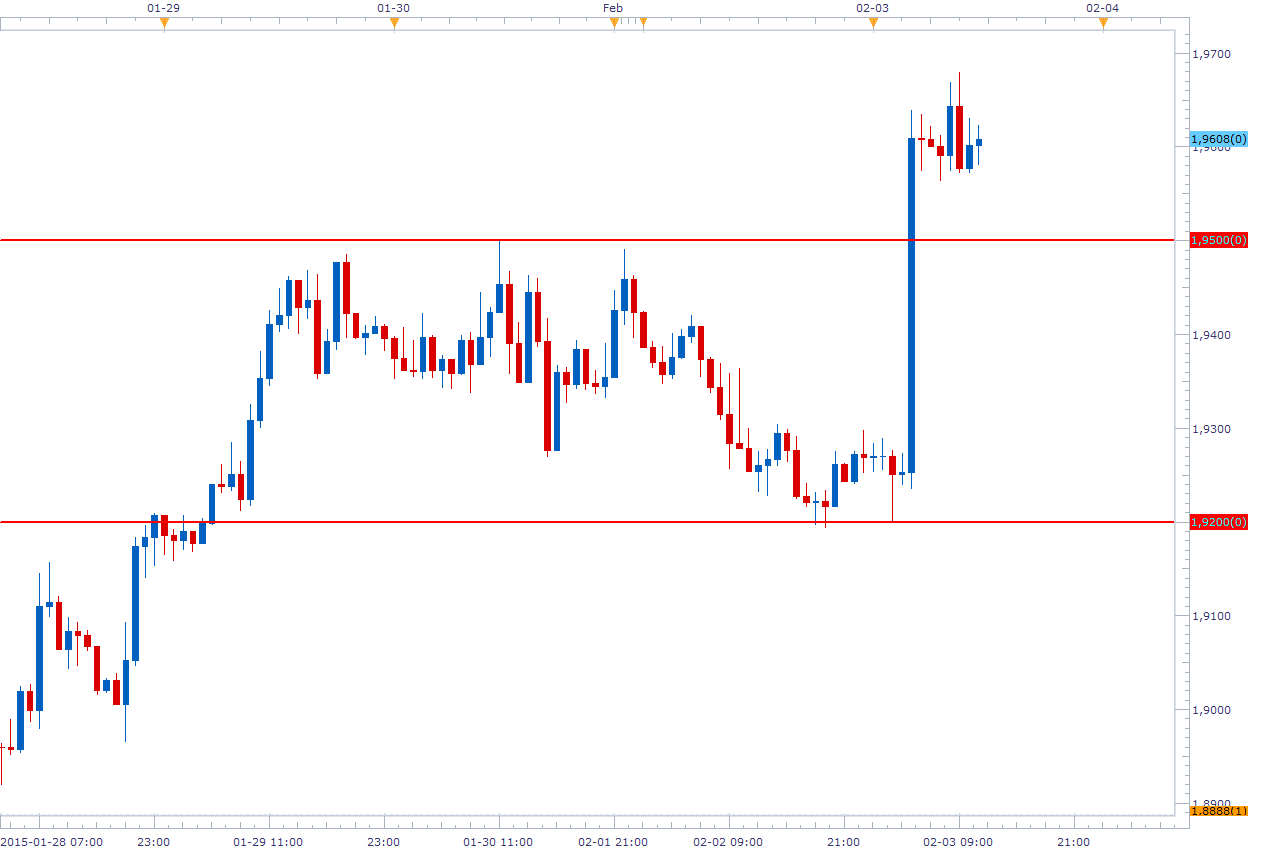
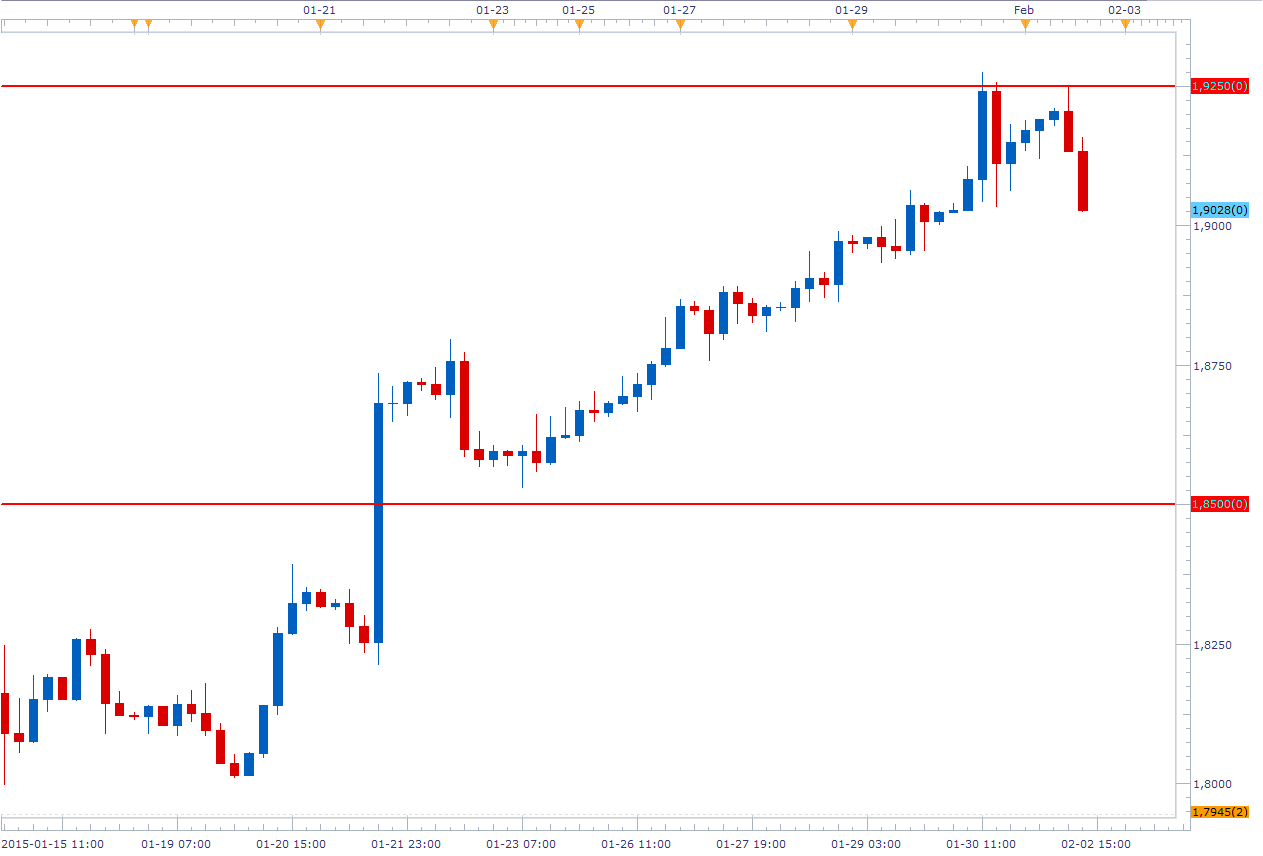
Not all that commanding BEEB, but still a BEEB. I had missed the close of the pattern so I decided to jump up to the 8hr chart, where I was greeted with the following:
This BEEB is much more commanding - admittedly, it is NOT forming at a swing low, however, this could very well be a solid retracement down to 1.8500! Considering we have a BRN at 1.9000, I’ll probably set an entry order below that level if I decide to enter. Still somewhat divided as to whether I should take this counter-trend trade or not. One thing that might happen is price might actually find support at the BRN and use that as a swing-low, which means I’ll have to be extra careful for that not to ruin my CT-trade.
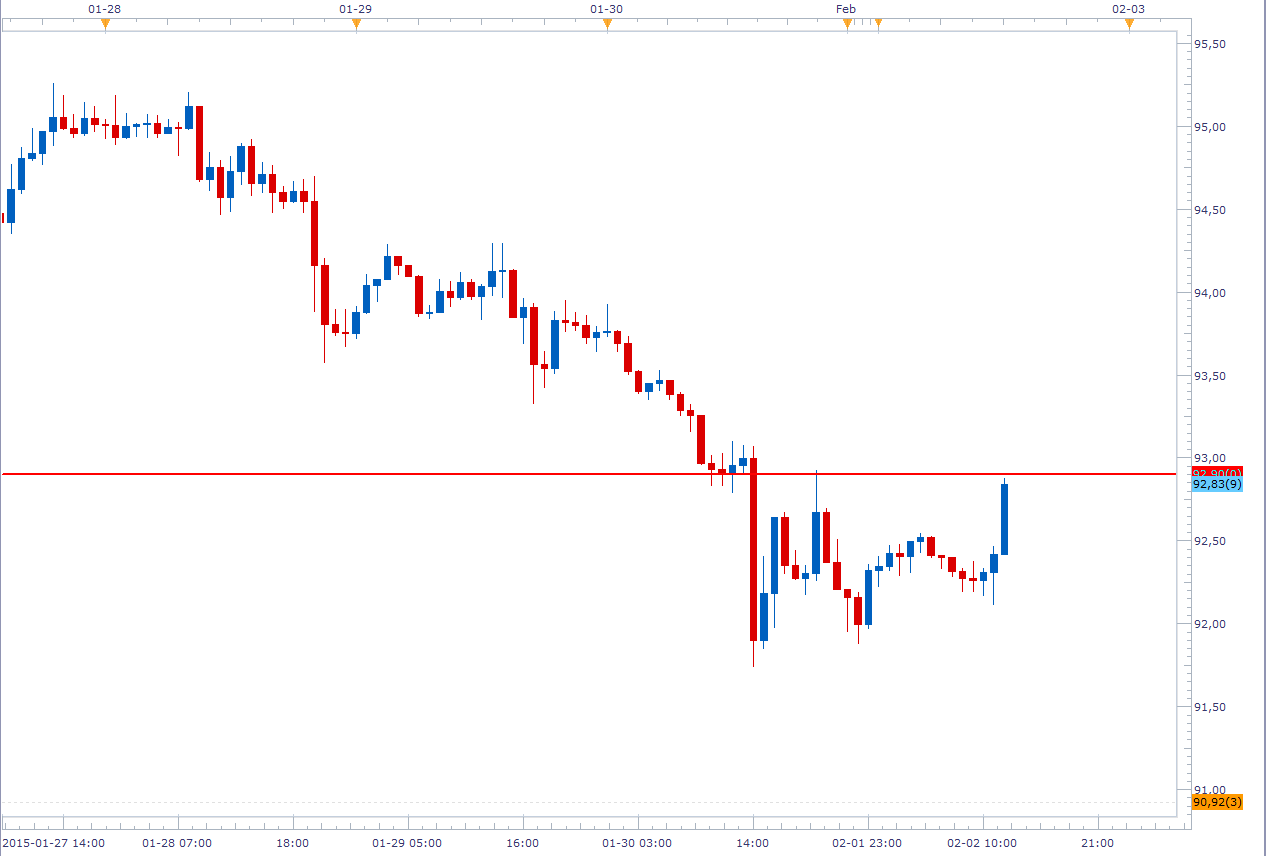
I’m also looking for PA to form at this 93 level on CAD/JPY’s 1 hour chart:
Thanks, looks like I haven’t reached that post yet.
By the way I have two quick question to everybody:
Do you watch for short term positive or negative correlation between the pairs you are watching, or if two heavily correlating pairs show good trade entries at the same time, do you open position on both of them?
What do you think about more volatile, minor pairs, like USDMXN, EURHUF and pairs like these, do you trade them with this method?
Hey guys, newbie here. Just went live last month, and I’m looking to solidify my PA strategy.
I know there are MANY good pages in this post, and there was a post I found a while ago that listed the most important lessons presented on different pages here. What page is it on?
Also, @Nikz, I was blown out of that GBPAUD short today, took that same signal you did but got destroyed on that massive bull run.
i was enter solid price action setup in EurNzd daily pinbar…
but Aud Cash rate news fully distroy my setup only 5mint.
i know that news does not effect in Trading, but now i fell that news news properly hart me.
plz anyone can tell me, whats wrong in my setup?
Yes @EternalNewb, my charts are NY close! It’s just that the pair was GBP/CAD and not GBP/AUD - my apologies for the confusion! I’m currently in a nice profit on GBP/CAD and I moved my stop to slightly above break-even, looking to make roughly a 1.5:1 R:R on the trade.
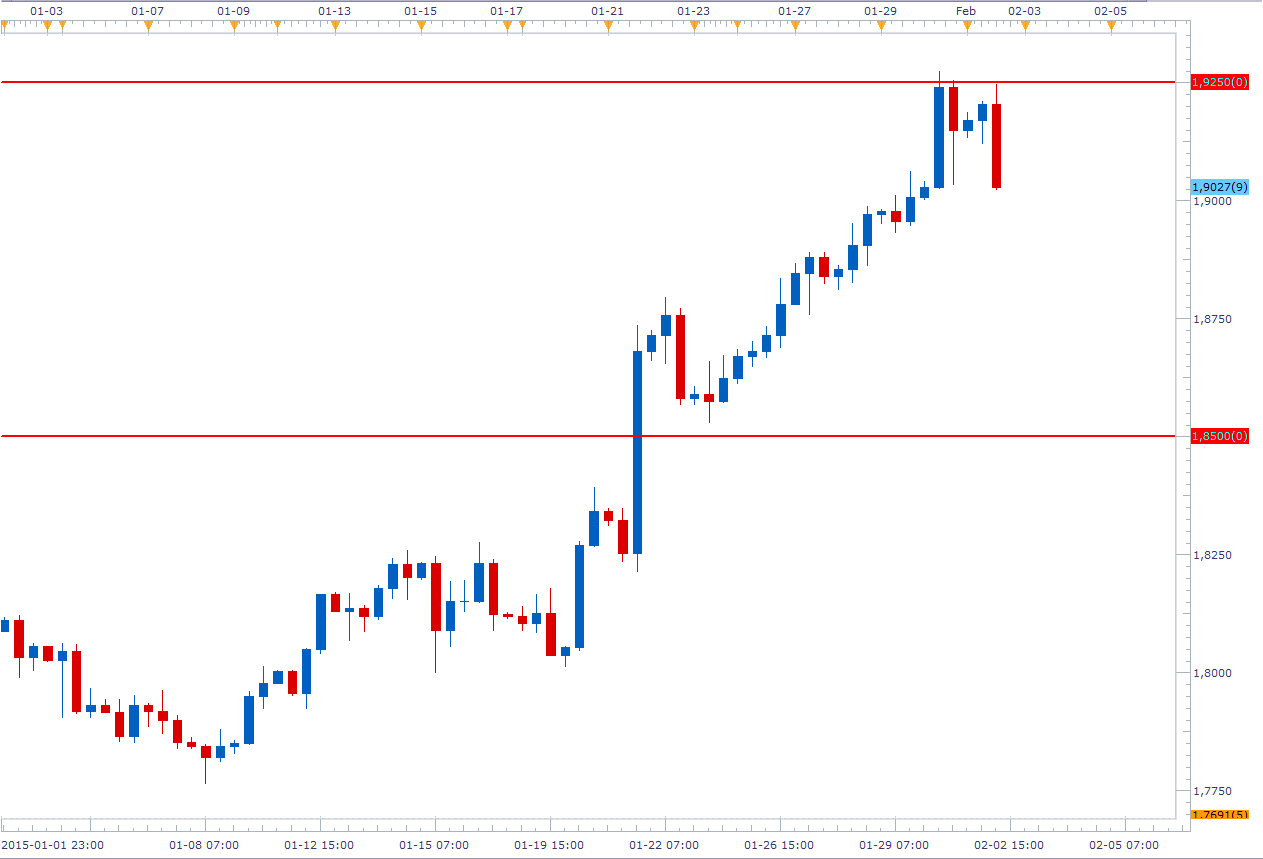
Speaking of GBP/AUD, this is the analysis I had done on the pair:
You see the pin-bar 2 candles before the huge bullish candle? I was going to enter there but I felt the signal wasn’t as commanding & obvious as I’d like it to have been - it diverted from some of my trading rules (as minor as they might have been) so I decided to stay away. I did miss a 4:1 risk:reward trade over-night but in the end I’m glad I managed to stay away. Setups that I don’t consider A+ aren’t ones I want to risk my money on, simple as that.
Well honestly, I’d blame the gap. The bearish candle after the pin-bar gapped higher, so there was an arae of support & resistance right there. Remember, support & resistance isn’t tied to one number, it’s an area where price might struggle to pass. So what I assume is a lot of traders thought price had broken the S&R where the gap was, they entered short, but only to get faked out by the market and thus stopped out, which made price move higher as we’ve seen.
If anyone thinks I’m wrong feel free to chime in, but instinctively that’s what I would say is the reason why the trade failed.
Do you see where you went wrong? There was a gap right there, price moved lower only to form a pin bar pretty much right thereafter, which faked out a lot of traders and had them stuck short, then price surged higher taking out a bunch of stop-losses which made price move higher along with any news that had people bullish on the euro.


 I’m currently in a nice profit on GBP/CAD and I moved my stop to slightly above break-even, looking to make roughly a 1.5:1 R:R on the trade.