I know I am not Dudest however I think I can answer. Dudest is not a member of my course, however I think you maybe getting confused as he was commenting about one of the articles I posted for all to see on my site. The link for this is on the previous page.
On my New York close charts I do not see any pin bar or even close. I am unsure what charts you are using however the area is solid for looking for longs should we get PA to confirm.
Quite a few pair moving into retrace mode which is exactly what we need to look for. In other words price is in a trend and is retracing back to nice levels to get into the trend.
For just one example of this is the EURUSD.
The chart below is the 4hr chart and I have highlighted where I would like to go long.
Hey thanks yes it is. As I couldn’t see what you were seeing I went down to the 1hr to see if I could spot any bullish signs and then forgot to change.
Below is my 4hr chart (much different to yours). This is a common problem. If people want to start using New York close charts just let me know.
Hi Johnathon,
Not also wanting to go off-topic, but decided to post here coz someone else may have the same issue.
My 4H chart also looks different from yours… The levels generally seem the same, but most of the candles vary…
Earlier in the thread when you mentioned New York close charts, I Googled, and from what I found, FXDD was said to have 5-day New York close charts. But now i’m not sure…
@CADJPY D1:
-> Also looks good to me, forming again at a relevant resistance level…though again, wish the body was bigger But looks big & obvious to me
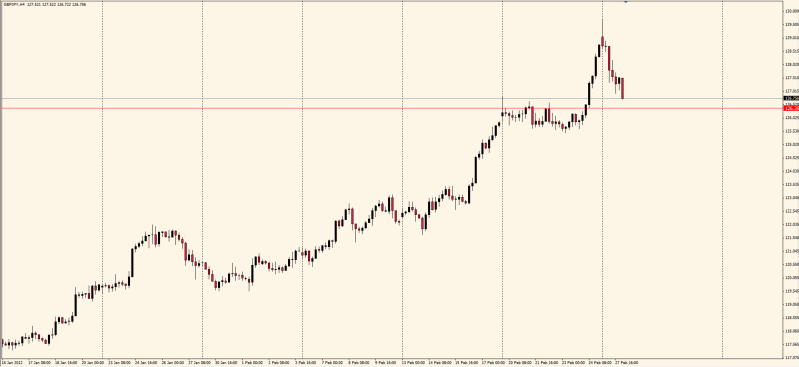
Compare request: been watching EURJPY (H4 attached). Retrace seems to have occurred to significant S/R level. Something of a pin-bar seems to have formed but hasn’t slapped me in the face with simplicity/obviousness; waiting for confirmation that uptrend is back…
Here is that same AUD/CHJF chart I was discussing shorts for yesterday. well more in keeping with trading with the trend it has now formed rather large looking BUEB. It is yet to close and I HATE posting before a candle has completed but due to time constraints I won’t be around when it does.
Keep an eye on it. It also shows how it is good to have a 2 way plan with PA. That way if the opportunity presents itself you can get short or long.
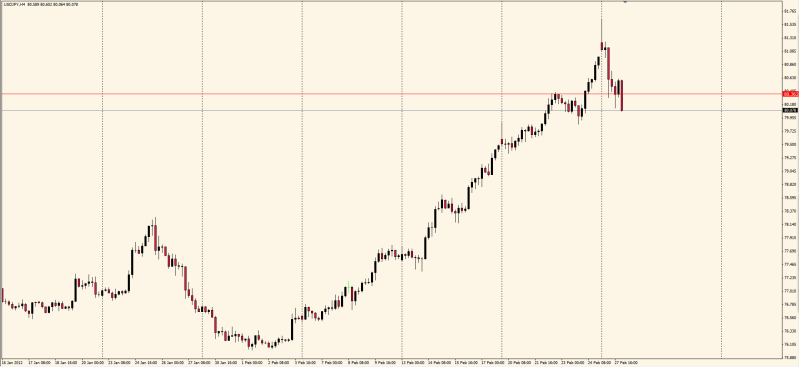
Hey everyone. I’d just like to point out that the price action on the USDJPY 4H seems to be a perfect example of what is being discussed in this thread. I can’t post a pic atm but will try to later.
Edit:
Well folks USDJPY didn’t pan out. Just goes to show that you (I) can’t win them all. Not to mention it’s a JPY pair…
Been reading the thread and very much like your simple, clean approach. I have a question though, how do you deal with setups occurring at the same time on correlated pairs? I would expect since correlated pairs move together you will have times when you get similar setups on each pair or is it that because we are looking only for the AAA+++ setups that this rarely occurs?
2 things can happen. Either you commit and choose the best pair that you feel has the highest chance of winning or if you are really torn you can split your risk and choose to play both (or on the odd occasion it may be basket of pairs, for instance if you think the Yen is weakening you can split up your risk on several yen pairs).
EG. Say a very simple example, you are intending to play 1 standard lot on a trade but you see 2 correlating pairs you BOTH really like the look of, you simply place half a standard lot on one pair and half a standard lot on the other. This is a very [I]very[/I] simple example but you get the general idea.
Johnathon may have something else to add but this is how I’ve seen him do it in the past.
Take more to read news about foreign exchange ,be careful trading reversal signals that have formed without a significant pullbacks or rotations. i will share the good articles or blog for you . best wishes for my friend.
A question: For this example I take the USDCHF pair. Daily trend is to the down side, I draw the major resistance on my charts and wait the Price Action to pull back to that level and give me, eventually a nice PB or EB to go short…
Now, the question : Looking at 1H chart, would we take a short trade if we get a PB or EB in that resistance on 1H chart , or we would expect the Price to test the resistance on the Daily chart and then ev. to go short ?
Here is the chart:


 But looks big & obvious to me