To me it is more of a indecision candle, moreover the next 4 hour candle formed a hammer/pinbar… Seems like price will be now going down.
Heya Aman,
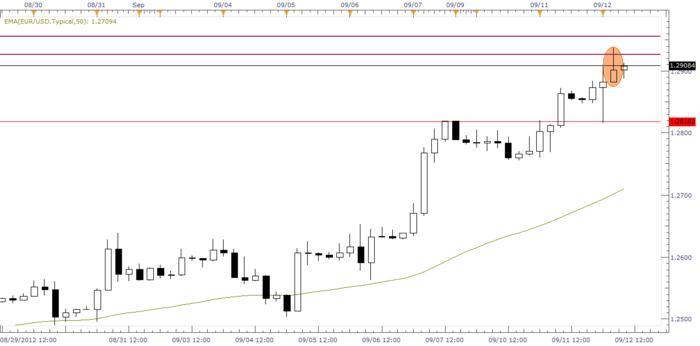
Would you not say this is more of a bullish candle rather than bearish and if anything saying the bulls are in control? For me price has broken out of resistance and has been roaring higher. Price today has rotated lower tested support and now moved higher to be well of daily lows. Trend solidly up on this one and I am looking for longs myself.
I would not trade BUEB from a high though.
Johnathon
Allright dudest, my problem is that I see possible trouble areas nearly everywhere and this causes my trade management problems. May I ask you how would you manage this?
About that entering lower than RN I don’t think a few pips matter, there’s many spikes so if in this case BEEB closed at 0.9801 (FXPRO) I don’t think it’s better to enter e.g. at 0.9789 because price could easily false break this RN and then bounce up.
Mike I agree about daily. I do it something like this: I analyse daily candles at every daily close and if the price is located near some important area I point it to the notes for the next day and then, the next day I also look for 4H signals around that levels. This was only example because I was confused about trouble areas.
Okay firstly the AUDCHF Pin is still in play. When you enter Pin’s you are going to have to expect price to move around and not straight up or down. Price never moves in straight lines. Pin Bar’s are still valid until price has gone through the other side or in this case this pin will stay in play and be valid until price goes through the high.
The main reason this is not pssibly the best trade to enter is because of the pullback. In around 300 of my posts I have spoken about only entering from value or sswnig points. In this case we can see 1 bullish candle. This does not make a swing or a pullback and hence not trading from value.
The next thing is you should be entering pins when price breaks the high or low. In this case if you were looking to enter your pending order would have been set to enter when the low of the Pin broke. Once the trade has gone we do not chase it and especially after two day. We let it go and move to the next trade.
Safe trading,
Johnathon
That’s a great way to do it. It does not take much to monitor the 4hr and daily TF. The best way to do it is watch the daily candles at daily close and then the 4hr candles during the UK/US session. This does not take much time at all.
Johnathon
This is something we have spoken about a lot in this thread i,e: Entering at value areas and the correct swing points. Reversal sigals such as the Pin & Engulfing bar need to be traded as reversals that they are. They are not continuation signals.
So what does this basically mean? It means that we need to be picking price to “reverse”. For example if you went long on the EURUSD of the BUEB you would not be predicting price to reverse (move from low to high) but actually looking for it to continue to move from a high to the next high. Does this make sense? To make this BUEB trade-able it would need to form at a swing low or rotation lower. We would then be buying low and selling high. We would also be entering at a low point and looking for price to reverse and move higher.
Johnathon
Yes, that’s how I do it, anyway I noticed that you often move SL to BE, how are you doing it? Is there any way to do it automatically? Or you just check your trade at every 4H candle’s closing and you decide whether to move SL at BE or take a partial PT.
Got it but then how about the pinbar that formed on the next 4 hour candle?
I manage trades manually. Some do with indicator that auto manages trades for them.
I do not discuss trade management etc in this thread sorry.
Johnathon
I am sorry I do not understand. I do not see a bearish Pin Bar. Are you able to throw up a chart with what you are thinking about so I can comment being better informed?
This is not a bearish pin bar, go back to the first pages and review the correct explanations of pin bars 
Okay I see what you mean.
The best way to look at this pair is from the daily chart. On the daily chart we can see price has moved up aggresively and all the short term momentum has been up. With this in mind I am looking to go long and not fight the up move. We can see price has also now moved higher, broken resistance and closed outside. As long as this old resistance holds as new support I will continue to look for longs.
I hope that rejection candle you have pointed out sends price lower because then I may get a chance to get on board the up-trend. I would however not personally trade such a weak looking signal against all the power of the recent up-move. No need to fight it when we can go with it.
Safe trading,
Johnathon
EURUSD DAILY CHART

Thank you for very clear explanation.
The line that you have on your daily chart, you can see I had the same line on my chart. I wanted to go long there but missed the entry as I was sleeping.
Have not yet gained enough confidence to place pending orders.
The pin bar got me thinking… well, thank you for explaining it clearly.
I will look to go long as price action gives me a signal.
No, I didn’t mean how you manage your trades but just if you for example watch market every 4H and in this times you move with your SLs’, PTs’ etc. or if you use some stuff to do it automatically e.g. if price hit X move SL to Y etc. Sorry for my bad English :15:
That is trade management!
Well, I haven’t considered this info as a trade management, so sorry about that, anyway I don’t think it’s reason to getting angry… Forget it.

