It’s engulfing yes but not closed bearish enough to trade in my opinion
You mean it should close below last bars open?
It depends on what’s in your plan, a general rule of thumb according to johnathon is that for it to be classed as a beeb we need to see the beeb candle close within the top or bottom 1/3 of the candle depending on direction of trading. So in your chart we would like to see price close in the bottom third of the beeb.
Personally I don’t calculate if its in the bottom third or not, all my pa analysis is done by eye, I can see from looking at a beeb or whatever the signal candle is if it has closed strongly or indecisively, so just a quick glance at the beeb you mentioned and straight away I can see this has closed indecisively and not giving me clear indication that price wants to continue lower. I also take into account the whole price action story, I don’t trade against the trend, only with it and in ranges, in your chart recent momentum is clearly with the bulls so with nzd usd h4 I am currently only looking to go long if price manages to break through the overhead resistance at the high of your beeb and rotate back to that level to form bullish pa at the now new support.
Hope this helps
Steve
It does.
Thank you.
It was a nice signal for H4, but am I correct in thinking the D1 PB is
- playing straight into resistance
- not from a swing/value ?
Even though rejecting the nice 80.00 area and with the most recent daily bullish momentum?
Fil.
PS. Shame I can’t play H4s but I work 9-5.


it too difficult to trade
in past it it resistance . at present it is support ?? I think we need a breakout to trade easier .
Firstly it is great to see so many new traders coming on board in here before getting caught up with all the rubbish indicators! I have not been in here lately as much as I would like but when we have other great members like Dude, Spongy and Juicy to keep everyone on track it make me rest easy knowing everything will stay on track so a big thank you to you guys and also the other regulars who are in here helping all the time.
Now to cover off a few posts that slipped through the cracks and to remind all what we do and what we are looking for and more to the point what to stay away from. Sorry some of these comments are late but they are better now than never.
Okay so this did not close like it would need to but even if it did this would have been a very dangerous trade. When we see Pins that have formed after nil to very small retracements they are quite often there to suck traders in to the next move in this case which was going lower. This was hanging out there and more of an inverted pin which is bearish signal rather than a strong bullish Pin.
Also whilst small wicks on the other side of pins can be okay, when we start seeing large wicks it can act as the opposite to a Pin. We know a Pin Bar is showing us rejection from a level. For example if we get a bearish Pin Bar at a resistance level we can then see that price is rejecting that resistance. This can be true of the wicks on the other end and when we are looking to enter a trade we do not want to see price being rejected in the opposite way. If it is then we will be trading into an area that price has rejected in the past and may happen again.
USDCAD DAILY CHART

Once again this never broker higher so like trade posted above you would not have been in this trade anyway (hopefully). What’s wrong with this setup? As we talk about all the time, price action trading is about taking the whole chart into account and not just the last candle. This was a very small price action signal and more of a worry was all the boxing/traffic above if it did break higher. If it did manage to break higher I think it would have been short lived with all that resistance it was trading back into. Price will normally go the easiest way and in this case that path was lower compared to all the traffic overhead.
GBPAUD DAILY CHART

As for the AUDJPY I have seen a few post about. I wanted to trade the daily Pin Bar however what kept me out in the end was the round number of 83.00 which has acted as S/R in the past and also that it was making a fresh high with a smallish Pin Bar.
Safe trading to all and great to see so many taking part in this thread and asking questions as that is the quickest way to learn!
Johnathon
hello ! i’m a newbie here… but first sorry for my english…
i just found a set up on usd/jpy (4H timeframe), however the candle still did not close yet, but if the candle closed and forming a pinbar like this can i enter the trade??

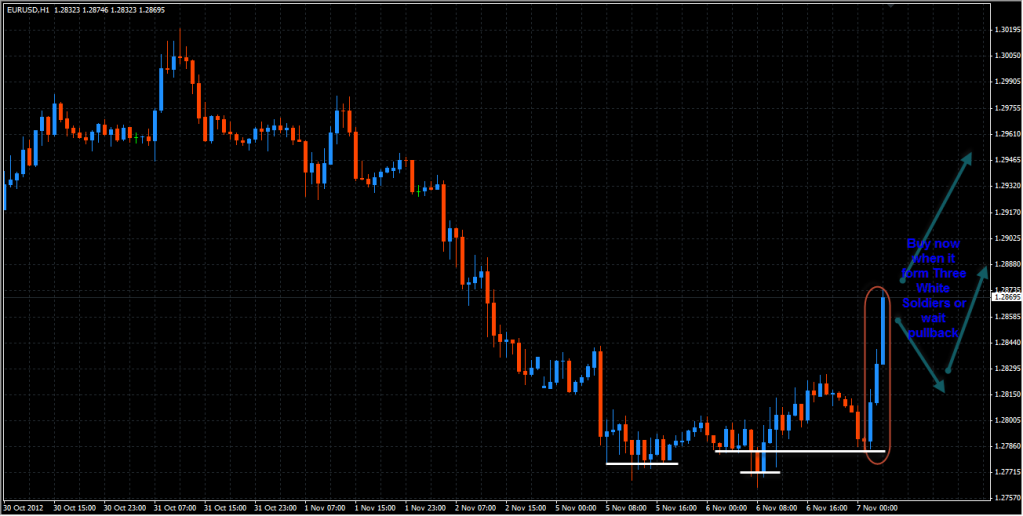
hi maxryan…here we most likely to by any pair with nice pullback to the previously acted R\S level…and vice versa in down trend.
as u pointed 3white solders …there is a bullish pressure in that move… …
but my advice is stick to h4 chart minimum…that will help u to learn moreand u will have less less fake signals…all the best
straight answer is NO
because this pair in the process of 123 pattern…
see the picture…where we like to form PA signals…i want to comment on this by some senior bro’s

If I were you I would look for a short entry around 1.2890 since the trend is obviously down. if the price breaks above it wait for pull back for long entry.

At above h4 time frame . Every broker will have a hour (close price) different .This thing can effect to pattern candle .
Example : i see Piercing Line H4 in my broker . But you don’t see Piercing Line H4 in your broker .it is a other pattern ???
Do you think so ?
And me i think from H1 —>M1 any broker will same
hi there Faz,
Welcome aboard the best show in town. Great to see you have nice clean charts.
Forgetting the fact that this pair is causing headaches for many of us , IMHO there would be no trade here. That latest bar is not a PinBar as prescribed in our rules. The CLOSE must be within the pre;)vious bar’s range ( Hi -Lo).
Although the zoomed out H4 trend is bullish, this Price Action is in no-man’s land & to me is sitting inside a range which is being protected on the low side by that 80.00 level.
Just my take on this but I will be waiting for a solid break away from those current prices and then pounce on a strong PA signal to enter.
If you have not already done so, it is essential for your learning of this Price Action method that you read the 1st 50 pages to grasp Johnathon’s teachings. Good Luck buddy.

nothing to worry…about that closing time…of candle…
always trade what ever u see in ur chart…
the better solution is take another broker mt4 and compare them…
most of the people over here doing the same …
one particular broker will have a different candle close time depend up on the server time zone…i think so…
Hey guys, just some questions:

Anyone taking this BUEB? Also it’s obvious this is trading straight into resistance but if you take the break of the high of the BUEB that means it is past resistance, am I correct?
I also want to ask if these can be considered as 2BRs?


Hi Guys - We are closing in on London Open and new bars forming. Has anyone spotted anything interesting for tonite. The only one I can find with any prospect is this EU on H4 - strong down trend , good long retracement so looking for some PA to get in the trend. Of course, Our USA cousins have re-elected their Boss and this could have a settling effect on markets. This being the case, we could see the Dollar gain in strength which would reinforce a resumption of the Bearish trend here. Anyone got a comment or two to add some interest to the nite shift here. :59::24::44:

hi omfgwtf…
ur questions are worth to me …am also looking at those…but i did not trade them…
((((except gbp-jpy(yesterday 2bar reversal)…but i exited at where i entered…and no loss…
i had to close the deal when it reached the 1fra level…bad luck…but i am happy …coz no loss to my capital…)))
i can not explain why…but i am feeling that those are not at appropriate level…
any how i am also waiting for answers from others…thank u
Well heres to my first post…i definitely agree. it looks like a double pin double top on the 4 hour developing on eur/usd.