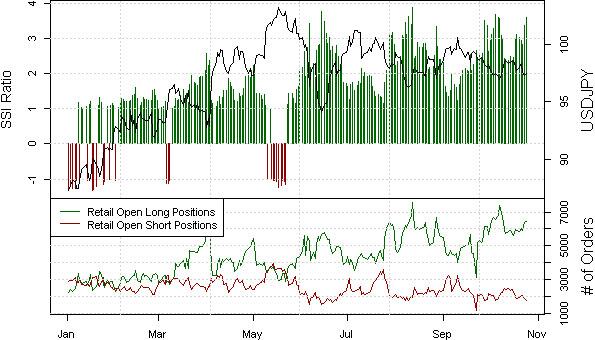
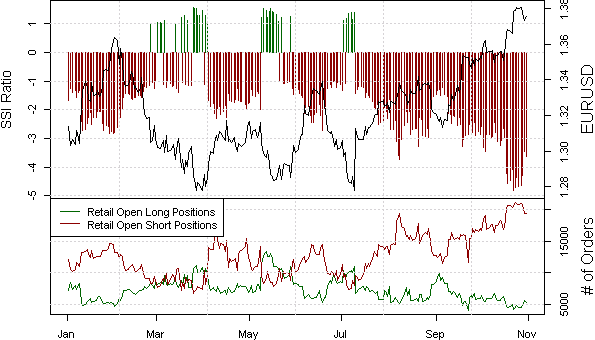
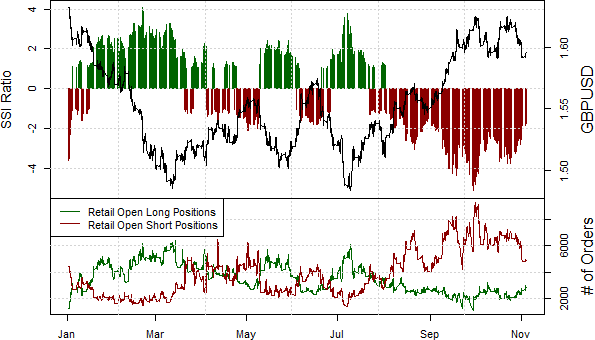
According the weekly update of the Speculative Sentiment Index (SSI) just released on DailyFX.com, the US Dollar looks to be at major risk of further declines versus the Japanese Yen. That’s because not only are retail traders still net long USD/JPY, their net long positioning has actually grown more extreme since last week.
Since SSI is a contrarian indicator, that’s a strong bullish signal for JPY. On the other hand, traders have reduced their short positioning in AUD/USD significantly. That could indicate that the US Dollar might have set an important bottom versus the Australian Dollar.
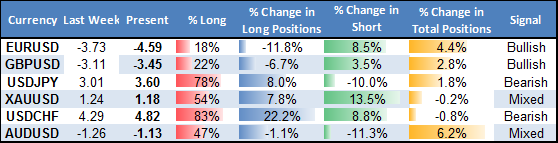
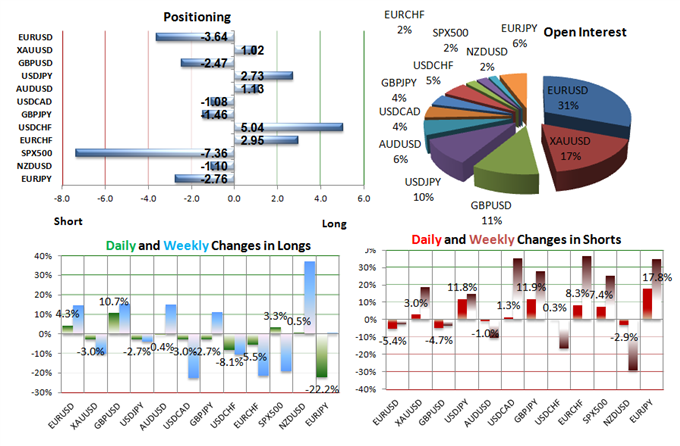
Weekly Summary of Forex Trader Sentiment and Changes in Positioning
It’s no surprise then that the sentiment-based trading strategies on DailyFX PLUS are currently giving signals to short AUD/JPY. In particular, the Momentum2 strategy is giving a signal to short the pair at current levels with a trailing stop at 94.8307.
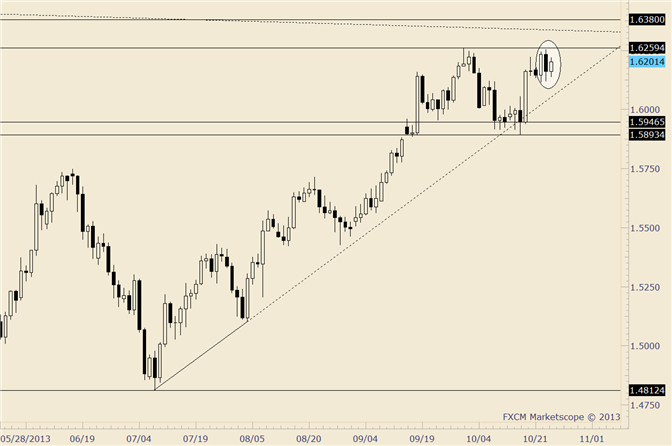
Senior Technical Strategist Jamie Saettele tweeted this morning about a range trading setup for GBP/USD:
“This month, GBP/USD has traded from 1.6259 to 1.5893 and back to 1.6255. Sounds like a range to me!”
He added these further details in his article on DailyFX.com:
"Exceeding the 10/1 high (1.6259-which is pips from the 1/2 close of 1.6252) still faces the January high (first trading day of the year in fact) at 1.6380.
GBP/USD Daily Chart
“GBPUSD has yet to confirm the EURUSD high. This market may very well remain within a range. With a high in place on 10/1, I am bearish for a return to the near term range lows (1.5950s) and maybe more.”
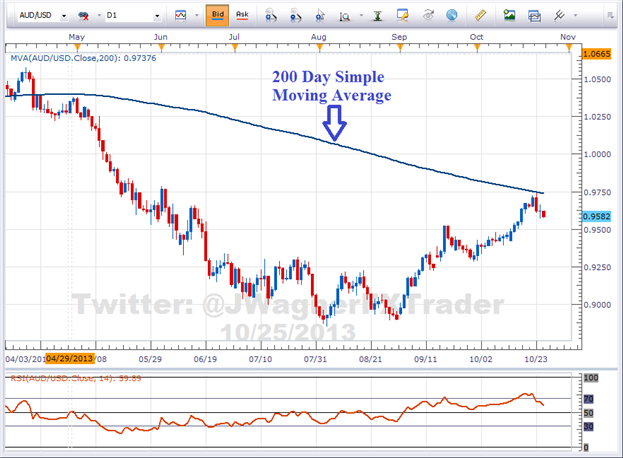
The AUD/USD pair found strong resistance at the 200-Day Simple Moving Average.
Jeremy Wagner, Head Forex Trading Instructor at DailyFX, had this to say regarding the Aussie:
[B]“Now that equities are near the top of their ranges, there is an increased probability of a dip to modestly lower levels. If the stock markets shift sideways to lower in the range, we can reasonably expect the Aussie to move lower. Therefore, the trading opportunity is to sell the Australian Dollar currency basket.”[/B]
In addition to the AUD currency basket, the Mirror Trader platform offers a variety of other Currency Baskets, including USD, EUR, GBP and JPY, as well as baskets designed to take advantage of interest rate differentials.
EUR/USD jumped about 40 pips on ECB Vice President Ewald Nowotny’s comment that there is no realistic prospect of a rate cut for the Euro.
DailyFX Quantitative Strategist David Rodriguez tweeted the following chart showing the strong correlation between EUR/USD and the net interest rate outlook of the ECB versus the Fed. This highlights the importance of the upcoming FOMC meeting.
A Dollar-positive reaction seems unlikely as FOMC officials will almost definitely keep current QE purchases unchanged; disappointing September Nonfarm payrolls data and the negative economic effects of the US government shutdown will keep the Fed’s bias towards easing through the foreseeable future.
Both the Breakout2 and Momentum2 strategies on DailyFX PLUS are currently giving signals to buy EUR/USD. DailyFX PLUS Trading Signals can be automated on your FXCM account with the Mirror Trader platform. You can use your Trading Station username and password to log into Mirror Trader.
For the past few weeks, DailyFX Quantitative Strategist David Rodriguez has written about how the US Dollar was likely to fall to fresh lows against the Euro as the Speculative Sentiment Index (SSI) indicated that crowds were their most short EUR/USD on record. Over this time, EUR/USD has reached its highest levels since 2011.
However, today Rodriguez called attention to the fact that the sentiment-based Momentum2 strategy on DailyFX PLUS has now gone in the opposite direction. This could represent an important turning point for the US currency.
Momentum2 is a trend trading strategy that aims to catch shifts in trend using trader sentiment as an indicator. The strategy looks to buy when SSI reaches its lowest value for the past 145 trading hours, and looks to short when it reaches its highest value for the past 145 trading hours.
The strategy is giving a signal to short GBP/USD because SSI hit its most extreme positive level for the past 145 trading hours, which suggests that the GBP/USD could be trending downwards. The trailing stop loss has been set at 1.61467.
Here’s an update on the Momentum2 trading signal to short GBP/USD from yesterday.
The weekly update from the Speculative Sentiment Index (SSI) that was posted on DailyFX.com adds further confirmation that the US Dollar may have set a lasting bottom versus the Euro, Australian Dollar, and British Pound.
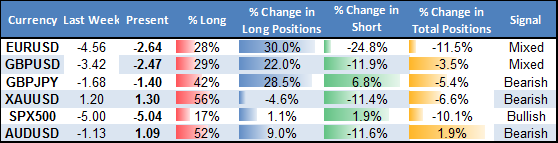
Weekly Summary of Forex Trader Sentiment and Changes in Positioning
It shows that traders have dramatically reduced their long dollar positions against these major currencies. Since SSI is a contrarian indicator, this shift in sentiment could be a sign of further US Dollar gains to come.
The fact that that the SSI-based Momentum2 strategy on DailyFX PLUS has now sold EUR/USD, GBP/USD, and AUD/USD serves as early confirmation of a potentially lasting Dollar bounce.
Another update on the GBP/USD short position entered by the Momentum2 strategy on Mirror Trader earlier this week:
The trade is now floating a 100+ pip profit, but is nearing a the 23.6% Fibonacci retracement at 1.59184 for the lows set back in July. It’s possible the pair might find some support here as it did in mid-October.
While it may be prudent to take some partial profits here, there are reasons to leave the rest of the position open with the trailling stop which has since moved down to 1.60333.
In particular, the Strong/Weak app shows that the British Pound has been underperforming noticeably on short-term time frames (m15, H1) after this morning’s data even more than the Euro.This could be a sign that a more significant technical breakdown may be beginning.
It’s just a matter of time before the GBPUSD tumbles. I’m short from 1.6150 and expecting a test of 1.56. If that level is reached, then I’ll re-evaluate my position.
The UK has the highest consumer debt of any of the major G7 nations at an astounding 98% (Italy 45%, Greece 65% and US 87%). The recent upswing in the GBP, EUR is purely consumer driven. Mortgage lending is now falling due to reduced availability of credit rather than demand. Consumers can expect to see hikes by energy companies as winter sets in, which will curb spending even more. All this, and other factors, keep me on the bearish side of this pair. That’s my 2 pips. Happy trading and take care!
The latest readings from the Speculative Sentiment Index (SSI) would seem to support your analysis on cable (GBP/USD). The ratio of long to short positions in the pair stands at -1.75 as 36% of traders are long.
Yesterday the ratio was -2.38; 30% of open positions were long. Long positions are 15.0% higher than yesterday and 28.5% above levels seen last week. Short positions are 15.4% lower than yesterday and 28.9% below levels seen last week.
SSI is a contrarian indicator to price action, and the fact that the trading crowd has grown less net-short from yesterday and last week is an indication that cable could continue lower.
The SSI-based Momentum2 strategy on Mirror Trader is still short GBP/USD from 1.60477 with the trailing stop having since moved down to 1.60043.
One final update on the GBP/USD short position from last week: The trade finally closed out for a profit when the trailing stop at 1.60063 was hit. This marks at least a temporary end to the strong US Dollar gains we’ve seen recently, so I’d like to change focus and look at a trading opportunity in one of the crosses.
Currency Analyst Gregory McLeod noted that AUD/CAD has been in an uptrend starting from the low at 0.9167 on 8/1/2013 peaking at 1.0046 on 10/28/2013. The pair has rebounded from near the bottom of the channel at 0.9828 on 10/31. If channel support holds near 0.9800, AUD/CAD could reach the top of the channel at 1.0113.
A possible entry is at 0.9928. However, a better on a pullback toward trendline support at 0.9814 would reduce the amount of risk on the trade. A daily candle close below the 0.9800 figure would invalidate this trade setup because the channel would have been broken.
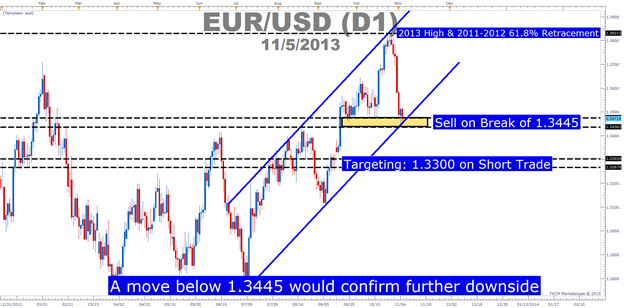
The ECB Rate Decision will be announced on Thursday at 12:45 GMT. Since the central bank has been outspoken about their focus on inflation, the recent CPI data makes this meeting one that will have the attention of many traders around the world as EUR/USD drops from 2013 highs.
[B]EUR/USD Setup going into ECB[/B]
Along with mentioning the trade setup above in his DailyFX article 2 Questions to Ask Before You Trade a Central Bank Rate Decision, Tyler Yell said “any indication that the ECB will act on worsening data or pave the road for December rate cuts or Quantitative Easing to weaken the Euro to assist the Eurozone in the face of deflation” could signal further weakness for the single currency.
Thanks Jason for the continued analysis that you provide!
Here’s my stance - I’m still short on the EUR$ from 1.3775. I will continue to hold this position until it reaches my target. The ECB will probably continue to hold tight on monetary policy, but indicate that they are on standby to act in order to stimulate the economy. Of course there is a chance that they will act now. Germany is the only country within the EZ doing well, the other countries are still paddling upstream - with one paddle. With high debt, low lending and high unemployment, help is surely needed. Also, with the US hinting at tapering, and EZ hinting at easing - I’m maintaining my short position until I see a change in the sentiment. That’s my 2 pips. Take Care!
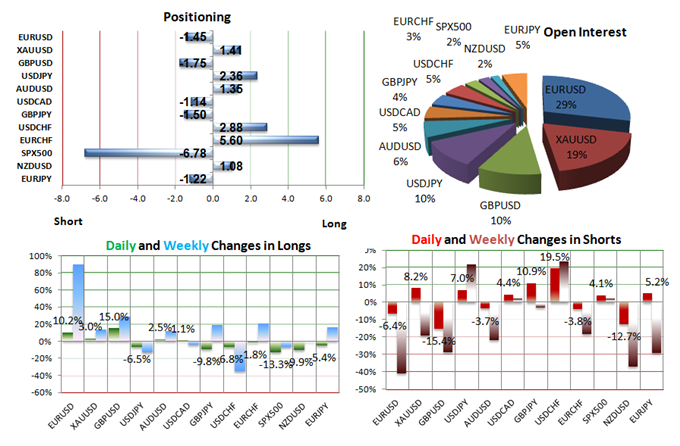
Weekly Summary of Forex Trader Sentiment and Changes in Positioning
"The US Dollar surged versus the Euro following the European Central Bank rate decision, but a substantial shift in sentiment warns of an important EUR/USD bottom.
“A massive decline in the Euro/US Dollar has been met with an aggressive wave of retail FX profit-taking, leaving crowds at their least net-short Euro since it traded to $1.31 in November. Today’s important swing in positions means that their next trades may actually be USD short orders (EUR/USD, GBP/USD longs).”
In fact, the SSI-based Momentum2 strategy on the Mirror Trader platform has just opened a GBP/USD long position at current levels with a trailing stop at 1.5995. FXCM account holders can use their Trading Station username and password to log into Mirror Trader.
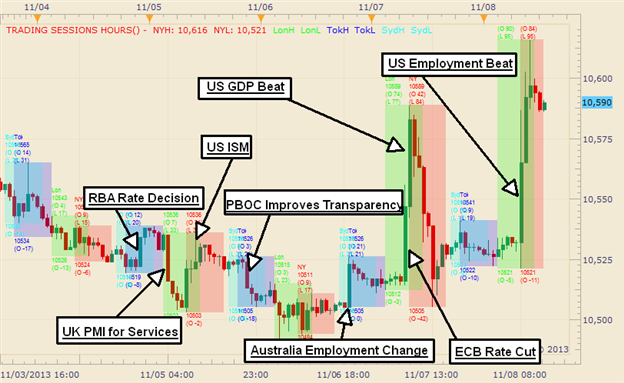
After a week of rises and falls, the Dow Jones FXCM Dollar Index finally established itself above last week’s high on the release of unexpectedly strong US change in Non-Farm Payrolls.
The Momentum1 and Momentum2 trading strategies from DailyFX PLUS are now giving signals to short AUD/USD to go along with a previous short signal that was given by Breakout2 earlier.
In my last post, I mentioned recent DailyFX PLUS Trading Signals to short AUD/USD. Now the Breakout2 strategy has given a signal to buy EUR/USD. Combining these signals, it’s no surprise that the latest indication from the Momentum2 strategy is the buy EUR/AUD.
Momentum2 is a trend trading strategy that aims to catch shifts in trend using trader sentiment as an indicator. The signal was issued because the Speculative Sentiment Index (SSI) has hit its most extreme negative level for the past 145 trading hours at -3.04428, which suggests that EUR/AUD could be trending upwards.
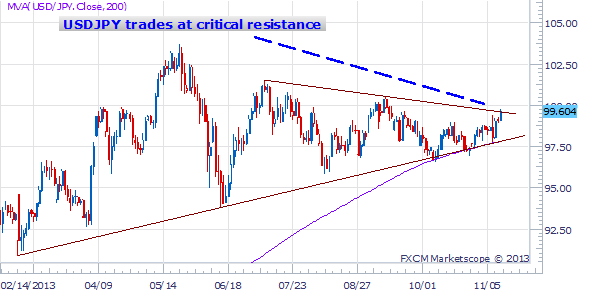
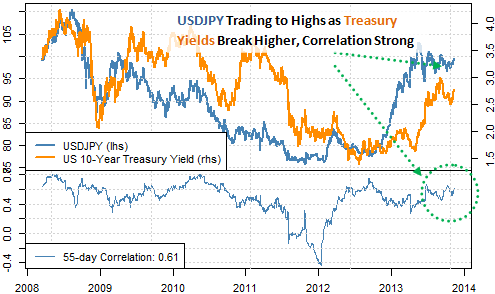
USD/JPY trades at critical resistance as it nears the ¥100 mark. Why might it continue higher? Here are five charts from Quantitative Strategist David Rodriguez along with his comments:
[B]US Dollar Surges vs Japanese Yen and Trades at Critical Resistance[/B]
"To understand the USD/JPY surge and gauge the likelihood of a further breakout, we take a look at a key driver: yields.
[B]USD/JPY Surges and Trades near Critical Resistance as Yields Rise[/B]
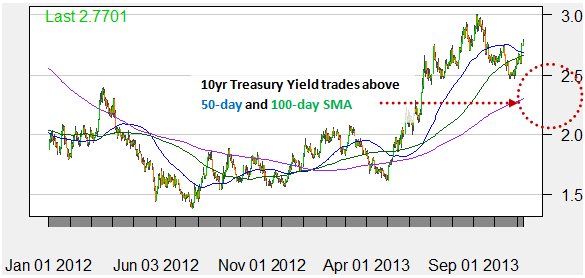
"The correlation between the US Dollar/Japanese Yen exchange rate and the US 10-year Treasury Note yield trades near multi-year highs, and it’s critical to note that yields have broken key resistance.
[B]US 10-Year Treasury Note Yield Breaks Key Resistance at 50-day and 100-day Simple Moving Averages[/B]
"Viewed from a yields/correlation perspective, we believe the USDJPY may indeed trade on to fresh highs.
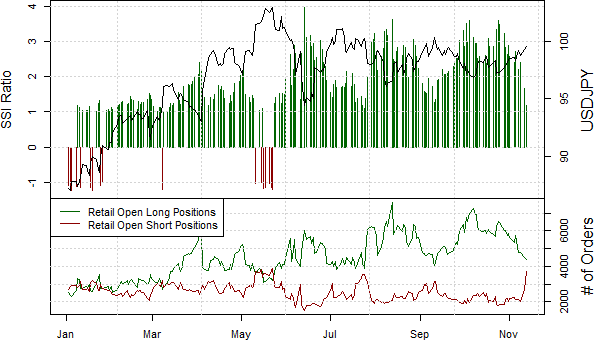
[B]Retail Forex Traders Have Sold Aggressively into the USDJPY Rally, Pointing to Further Gains[/B]
“Retail forex short interest in the USDJPY has surged 80 percent since last week and is now at its highest since the pair traded above ¥103 in May. Obviously any important shifts in price and sentiment could derail our USD/JPY-bullish forecast. But in the meantime we like trading it higher.”
I don’t know…I’ve made good profits swing trading the $yen both ways for the past few weeks. I’m not totally convinced that the pair is going to move much beyond 100.00. Right now I’m looking for a move down to 98.25 - 98.00. If I’m wrong, then I’m just wrong. Just my 2 pips. Take care.
I agree with you , if your wrong then we’re both wrong. UOTE=mad4fx;564767]I don’t know…I’ve made good profits swing trading the $yen both ways for the past few weeks. I’m not totally convinced that the pair is going to move much beyond 100.00. Right now I’m looking for a move down to 98.25 - 98.00. If I’m wrong, then I’m just wrong. Just my 2 pips. Take care.[/QUOTE]
You guys might be onto something here. The ratio of long to short positions in USD/JPY stands at 1.26 as 56% of traders are long. That’s not a strong bias in either direction.
On the other hand, long positions are 17.4% below and short positions are 60.6% above levels seen last week. SSI is a contrarian indicator to price action, and the fact that traders are starting to short USD/JPY more (they are less net long than before) could be a signal that the pair could continue higher.


 Just my 2 pips. Take care.