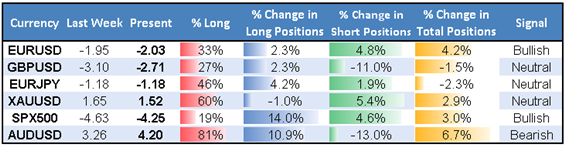
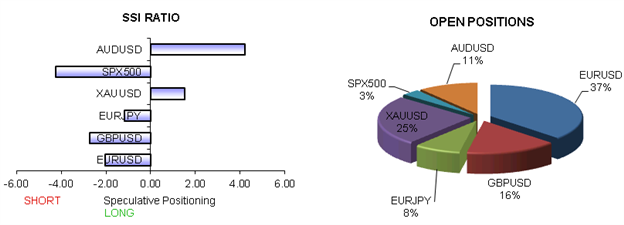
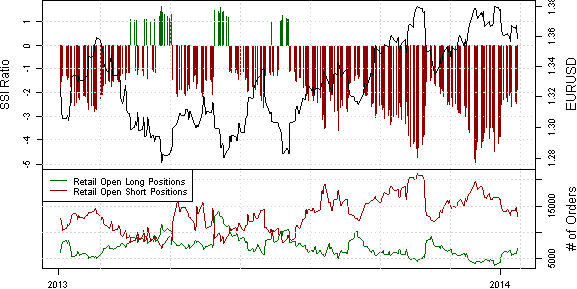
The latest reading from our Speculative Sentiment Index (SSI) show that retail traders are heavily long the US dollar going into today’s FOMC announcement, particularly versus the Euro and British Pound.
[B]SSI for EUR/USD is -4.28[/B]
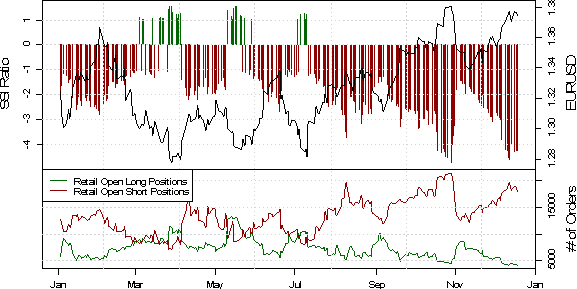
That means there are 4.28 short positions for every long position in the pair.
[B]SSI for GBP/USD is -3.61 [/B]
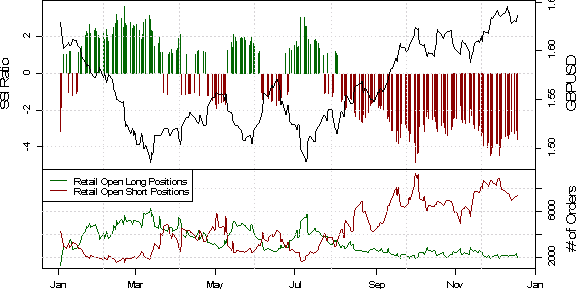
That means there are 3.61 short positions for every long position in the pair.
Not only that, but short positions in these pairs have recently increased while long positions have decreased meaning that retail traders have grown even more bullish on the US dollar leading into FOMC.
SSI is a contrarian indicator, so the combination of current sentiment and recent changes are a strong signal that EUR/USD and GBP/USD could continue higher with today’s Fed comments being a possible catalyst.
On the flip side, if today’s FOMC meeting turns out to be USD bullish, the resulting drop in EUR/USD and GBP/USD could be muted, since so many traders are already short those pairs.

As a result, a couple of the SSI-based automated strategies on our Mirror Trader platform (Breakout2 and Momentum2) are buying GBP/USD at current levels.
The latest readings from our Speculative Sentiment Index (SSI) for GBP/JPY stand at -1.44 meaning that 1.44 retail traders are short for each trader that’s long. Long positions in the pair have dropped 26.1% since yesterday’s FOMC meeting when SSI was at -1.15
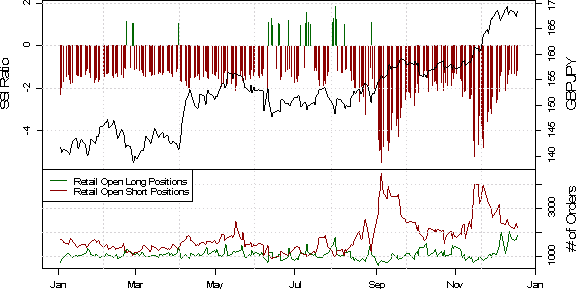
Since SSI is a contrarian indicator to price action, the fact that the majority of traders are short gives signal that GBP/JPY may continue higher. The fact that the trading crowd has grown further net-short from yesterday gives a further bullish trading bias.
Hello jason, my question is where can we click the fibonacci extention, since i could not find it in the fxcm trading platform taskbar. thanks
DailyFX currency analyst David Song wrote this morning about how the US Dollar climbed to a 5-year high versus the Japanese Yen on today’s GDP data.
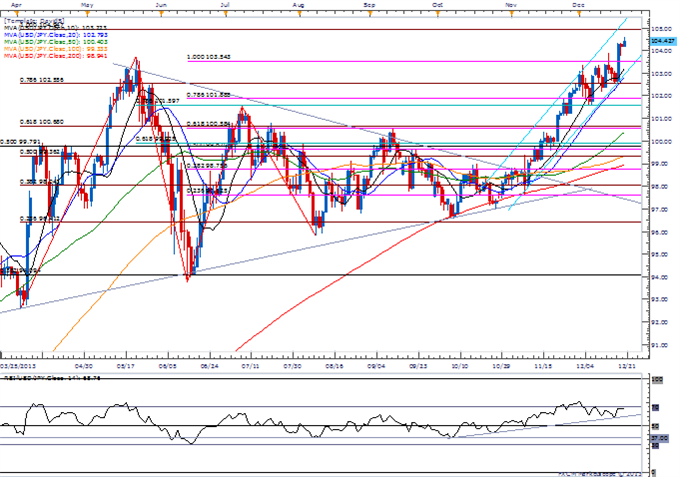
Meanwhile DailyFX trading instructor Jeremy Wagner tweeted the following chart setup this morning noting that a nice 3000 pip range is developing between $13.10 and $12.80

Some people get discouraged from trading USD/MXN because they see a 30 pip spread which at first glance seem huge compared to a major currency pair. However, it’s worth noting that the value of a pip on USD/MXN is less than 1 cent (rounded values shown on Trading Station below) for a micro (1k) lot trade compared to 10 cents for micro (1k) lot trade on EUR/USD.

That means a 3000 pip range represents about $23 and a 30 pip spread translates to a transaction cost of about 23 cents. In fact, according to the latest survey by the Bank of International Settlements (BIS), the Mexican Peso is now the ninth most traded currency in the world.

Hi Dennis,
I responded to your question here: 301 Moved Permanently
Happy New Year, Everyone!
Today the US Senate is expected to confirm Janet Yellen as the next chair of the Fed to take over from Ben Bernanke at the end of this month.

CNBC commented that Bernanke “has succeeded in establishing something of immediate value for Ms. Janet Yellen, his talented successor: A quantitative easing exit policy that has been communicated well externally, that markets seem comfortable with, and that has a chance of playing out as planned.”

Though Yellen’s first scheduled meeting as chair is not until March 18 to 19, we do have a critical jobs report coming out this Friday, which is likely to provide a clue as to whether the Fed will be able to continue tapering as planned or hold steady.
[B]Forex Volatility Prices Remain Elevated, Signaling Potential Market Turmoil Ahead[/B]

If market conditions do in fact become strained and volatility rises substantially, DailyFX quantitative strategist David Rodriguez said “we would then look to our volatility-friendly Breakout2 strategy as our preferred tool to take advantage of market shifts”.

Breakout2 is currently giving a signal to buy EUR/JPY at current levels. If you have a live FXCM account, you can use your Trading Station login to access the Mirror Trader platform and automate this strategy.
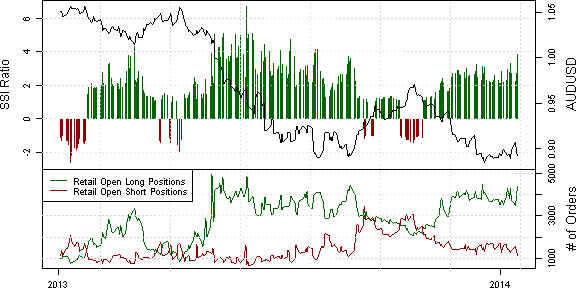
The Momentum2 strategy on the Mirror Trader platform just gave signals to short AUD/USD and buy USD/CAD at current levels with trailing stops 70-80 pips away.

For both currency pairs, the Speculative Sentiment Index (SSI) has hit its most extreme negative level for the past 145 trading hours with retail traders shorting the US dollar versus the two commodity currencies.
SSI is a contrarian indicator to price action, so the fact that the majority of traders are short the US dollar gives signal that the currency may continue higher.
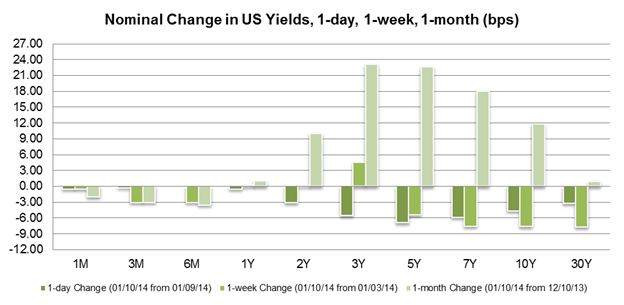
[I]Today’s ADP Employment figure of 238k vs. 200k expected was the single best print since December of 2012, when the figure came in at 209K, sending US Treasury yields and the US Dollar higher.[/I]
While not always the most reliable guide for the government Non-Farm Payrolls report due on Friday, January 10, it does give guidance on private-sector hiring.
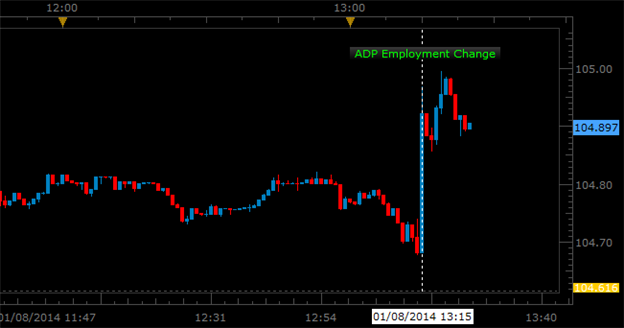
That is why Treasury yields went up in anticipation of the Fed continuing to taper. Yields rise when the price of Treasuries fall. And as yields rise, that is bullish for the US Dollar. Yesterday, I mentioned that the Momentum2 strategy on Mirror Trader went long USD versus AUD and CAD.

[I]Past performance is not necessarily indicative of future results.[/I]
Currently the AUD/USD trade is still trading at the same levels, and the USD/CAD trade is now floating a 70 pip profit. According to DailyFX PLUS, the USD/CAD signal is still valid to enter now at current levels which means that conditions could still be favorable for the US Dollar to continue higher.
[I]Today the ECB decided to keep rates unchanged at the historically low level of 0.25% and hammered home the message that rates will stay low for a very long time.[/I]
A scan of this morning’s best and worst performers vin the wake of the ECB press conference shows that the Euro’s previously amassed gains over the past 24-hours have relented, with the EUR/JPY as the worst performing pair on the H4 timeframe.
[B]Intraday Price Perspective[/B]

However, on lower timeframes (m15 and H1), the Euro has already started to stabilize. Below are the key technical levels being watched today by DailyFX analyst Christopher Vecchio. Note there is potential for a breakout beyond these levels with tomorrow’s NFP announcement.
[B]EUR/JPY H1 Chart: June 2013 to Present[/B]

“As a sideways range has no bias, longs are eyed >143.20 (stop under ECB low of 142.00) and shorts are eyed <141.45(stop above weekly high of 143.20).”
EUR/USD H1 Chart: June 2013 to Present
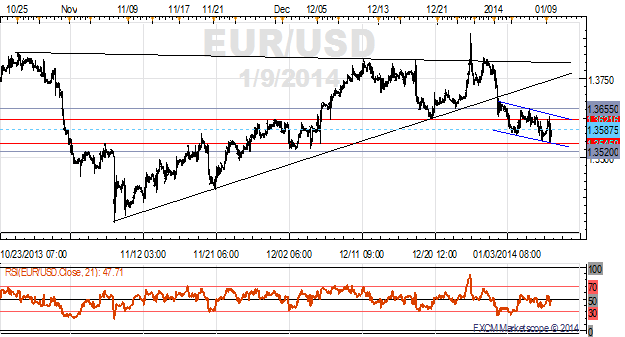
“Bulls will need >1.3655 before further gains look attainable (stop under ECB low of 1.3545); bears will need to see price trade <1.3520 (stop above ECB high of 1.3635).”
I simply loved your Euro chart mate.
I am new here and always looking for such stuff to improve my knowledge.
Thanks for sharing mate.
Keep sharing 
Thanks AJ, and please let me know if you have questions about any of the strategies I discuss in this thread :22:
Welcome to the forum!
[I]The US Non-Farm Payrolls Employment report came in at the worst levels seen in 2 years: +74K versus +197K expected, from +241K previously.[/I]
The gut reaction of the markets was that this would halt the Fed’s plans to taper at least for the short term.
As a result, Treasury yields and the US Dollar sunk on the news.
[B]USD/JPY 1-minute Chart: January 10, 2014 Intraday[/B]
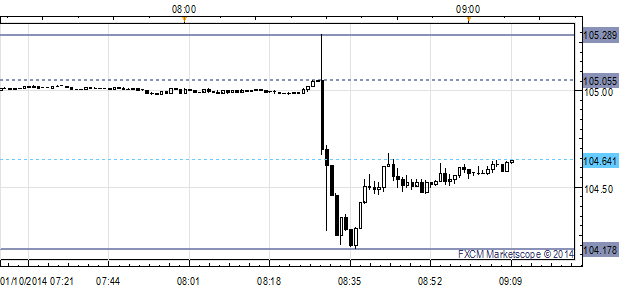
The Japanese Yen and British Pound were the biggest beneficiaries immediately after the number.
[B]GBP/USD 1-minute Chart: January 10, 2014 Intraday[/B]

Since then, the Momentum2 strategy on Mirror Trader has gone long EUR/USD and GBP/USD and long USD/CAD.

Past performance is not necessarily indicative of future results.
Last week we highlighted several key factors that left us in favor of further Japanese Yen strength. Namely: a build in Forex volatility prices/expectations, extremely one-sided JPY positioning, and the potential for a break of Yen resistance (USDJPY, EURJPY, GBPJPY support) warned of a potentially significant rally.
A scan of this morning’s best and worst performers on the StrongWeak app of the first full trading day after the weakest US labor market report since January 2011 shows that capital is returning to risk sensitive assets.
Intraday Price Perspective

In particular, the Japanese Yen has started the week sharply higher versus the British Pound, Euro, and US Dollar. Why might it continue higher, and how can we trade it? Quantitative strategist David Rodriguez addressed these questions this morning on DailyFX.com:
DailyFX Individual Currency Pair Conditions and Trading Strategy Bias
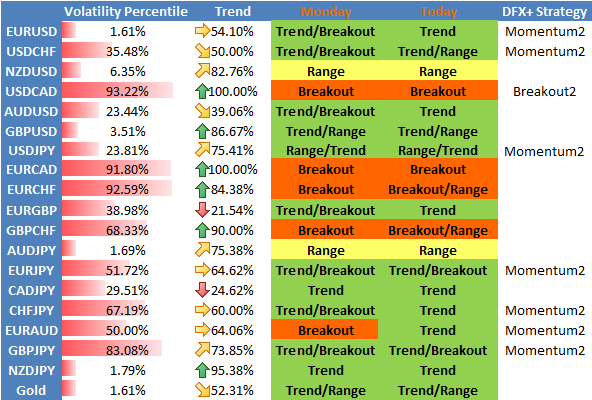
"Our SSI-based Momentum2 strategy on the Mirror Trader platform has had a busy several days as it is now short USD/JPY, EUR/JPY, GBP/JPY, and CHFJPY.

Past performance is not necessarily indicative of future results.
“We like said positions as long as USDJPY continues to make a series of lower highs and lower lows.”
Yesterday’s hawkish remarks from Atlanta Fed President Dennis Lockhart failed to prevent a breakdown of the US Dollar, allowing gold to continue building upward. Currency strategist Ilya Spivak provided the following technical analysis in his article on DailyFX.com:
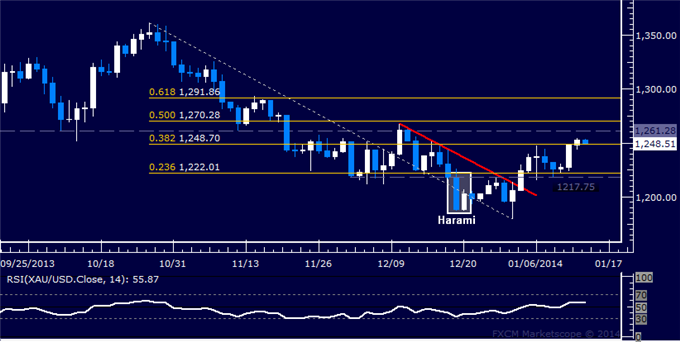
“Prices turned higher as expected after putting in a Harami candlestick pattern. A break above resistance at 1248.70, the 38.2% Fibonacci expansion, has exposed the 1261.28-70.28 area (marked by bracketed by the October 11 swing low and the 50% level). A further push beyond that targets the 61.8% Fib at 1291.86.”
According to a tweet this morning by DailyFX technical strategist Jamie Saettele, USD/MXN is “getting flirtatious with breakout”

For all his latest trade ideas, you can follow Jamie Saettele on Twitter.
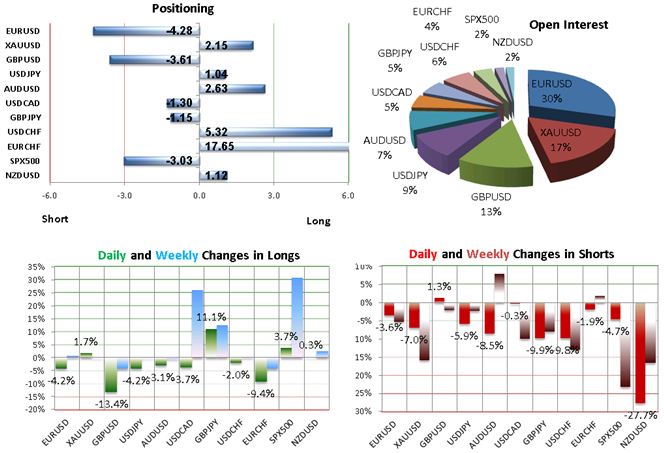
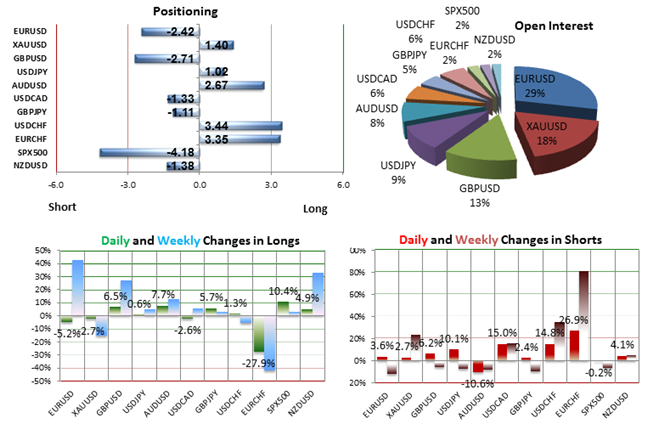
It’s Thursday, so the weekly update of our Speculative Sentiment Index (SSI) was posted today on DailyFX.com
Weekly Summary of Forex Trader Sentiment and Changes in Positioning
Recent trends likely to persist in absence of major event risk the remainder of the week. The clearest opportunities in the market right now may be in the EUR/USD and AUD/USD.
EUR/USD: Retail forex traders are selling into Euro weakness against the US Dollar, and this acts as contrarian signal that the pair may turn higher in the near-term.
The pair broke its pre-NFP range to the upside, leading to a short-term bullish technical bias. With price holding above $1.3560 and the retail crowd becoming more short on balance, it is possible to see further highs over the coming days.
AUD/USD: Retail forex traders are now their most net-long the Australian Dollar since the pair bottomed near the $0.8900 mark in September.
After the pair slumped back below $0.8900 after its NFP-fueled rally, the retail crowd began reducing shorts and adding longs. That trend has continued as the AUD/USD has broken below the 2013 lows, suggesting that further losses may be in store.
Currency strategist Ilya Spivak shared the following technical analysis today in his article on DailyFX.com:
[B]Dow Jones-FXCM Dollar Index (ticker: USDOLLAR) Trying to Clear December Swing Top[/B]

Prices are testing above resistance at 10727, the December 20 high. A break above this barrier exposes 10761, the intersection of the 38.2% Fibonacci expansion and the top of a rising channel set from early November.
[B]S&P 500 (symbol: SPX500) Fails to Breach Above 2013 Yearly High[/B]

Prices are testing resistance in the 1844.90-49.10 area, marked by the December 31 high and the 14.6% Fibonacci expansion. A break higher exposes the 23.6% level at 1863.10. Near-term support is at 1819.60, the 14.6% Fib retracement.