Comments: Long-Term (Weekly and Monthly TF’s) situation is quite unique. If gbp/usd price will keep growing - we will have an “MF Domino Principle”: FZRw1 up + FZR MN up. This is quite rare situation which will “open” the way to 1.75-1.8 targets.
The GBPUSD was indecisive yesterday. Price attempted to push higher, topped at 1.6856 but closed lower at 1.6807. The bias remains neutral in nearest term. Important intraday range to be closely watched remains between 1.6750 – 1.6850. A clear break below 1.6750 could trigger further bearish pressure testing 1.6700 or lower. On the other hand, a clear break above 1.6850 could trigger further bullish pressure testing 1.6900 or higher. Overall I still prefer a bullish scenario at this phase.
Small “middle-week” recap on GBP/USD “new” situation.
As trend up proceeds MF pivot moves together with the price, that way we constantly go with market where it goes.
As you can see from picture above - MF protective pivot and MF Channel are not broken. But AO - is starting to show, that wave level of current correction is higher than h4, which means that a new cycle is starting. After confirmation of MF pivot and MF channel we will have following options:
As a conclusion:
Gbp/Usd mid-term trend up is still valid. There is a “stop” on smaller TF’s, and Gbp/Usd will be facing a “moment of true” upcoming week. But For this trend up (purple wave) to turn around - FZR down of h4 wave level (at least) is needed.
GBPUSD on the daily chart, the price is moving down along with a bearish trend. On the break of the trend line around 1.6850, we should see an upward thrust.
As mentioned before - as long as MF protective pivots are not broken - trend up will proceed.
Now we have a “New Reference Point MF”. And also a New protective MF pivot (please see picture)
New MF Protective pivot is created (1.7060). As long as this pivot is not broken - trend up will proceed.
If price will break through the protective pivot = trend up of wave level h4-d1 (thats started from 1.6680) - will stop at least. To turn this trend around, a FZR of appropriate wave level is needed.
Gbp/Usd made an impulse down of D1 Wave Level, which stopped the trend up. But to turn it around a FZR down of higher Wave Level is needed.
During next couple of weeks Gbp/Usd will come back in to his “moment of true” and will show us "what it want’s to do
The impulse down is still developing. At the moment it reached “weekly” Wave Level already.
For this impulse to stop - a FZR up of h4 wave level is needed
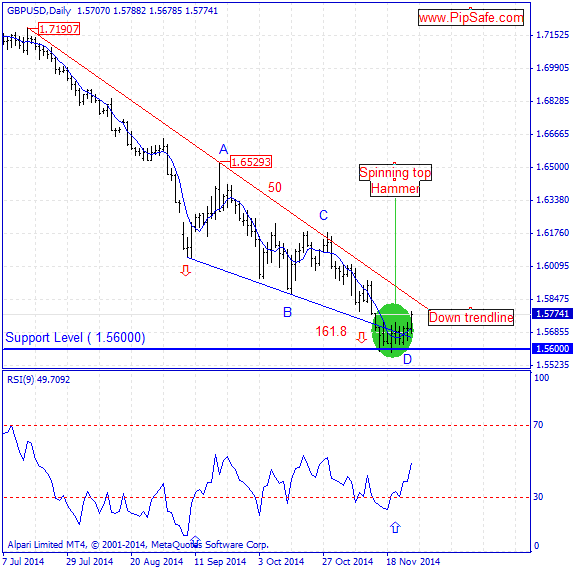
GBP/USD from 2014.07.15 had a strong descending trend with little reformation that shows the decision of sellers in reaching to the long term targets. This currency pair during its movement could record the low price of 1.56000.The price by reaching to the psychic level of 1.56000 could not pass it and retreated which the usage ability of this level can be seen in 1H time frame.
As it is obvious in the picture below, between the top price of 1.65293 and the bottom price of 1.56000, there is AB=CD harmonic pattern with the ratios of 50 and 161.8 that the D point of this pattern is completed and warns about ascending of the price.RSI indicator confirms the mentioned bottom price and it is in saturation sell area and also by being in divergence mode with the price chart warns about the price changing direction.Please note that If price rises and buyers success one of the price targets would be down trendline(made of three top prices). Generally until the supportive level of 1.56000 is preserved , the price will have the potential for reformation of descending trend and reaching to the down trendline .
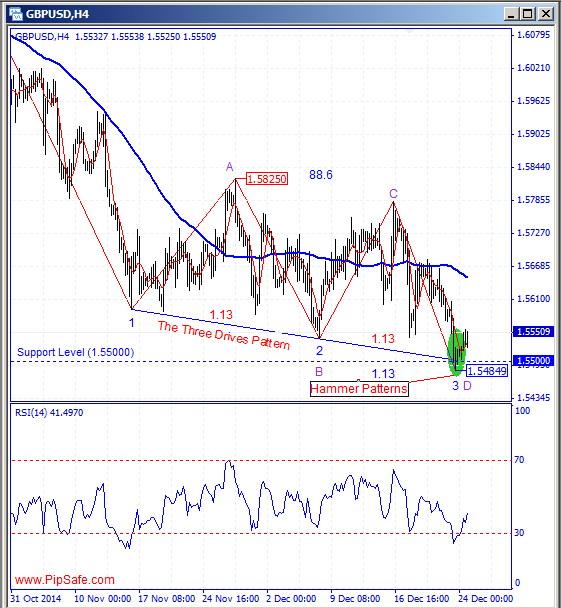
GBP/USD had an descending trend without a noticeable reformation during the recent weeks that shows Sellers certainty in reaching to the predetermined targets.The price could record the Bottom price of 1.54849 in 4H time frame which is fixed by ascending candle(Hammer Patterns).As it is obvious in the picture below, price during the descending has touched the Support Level (made of 2 bottom prices) and also the round supportive level of 1.55000 and has created the hammer candlestick patterns.
According to the formed movements in the chart, there is AB=CD harmonic pattern (Also the The Three Drives Pattern) with ideal ratios of 88.6 and 1.13 between top price of 1.58250 and the bottom price of 1.54849 that warns about changing price direction from the D point of this pattern.RSI indicator is in saturation Sell area and confirms the D point of this pattern by the next cycle and warns about the potential of ascending of the price during the next days.One of the important warnings for ascending of the price is formation of the candlestick pattern in daily time frame or closing of a ascending candle which prepares the field for ascending of the price.
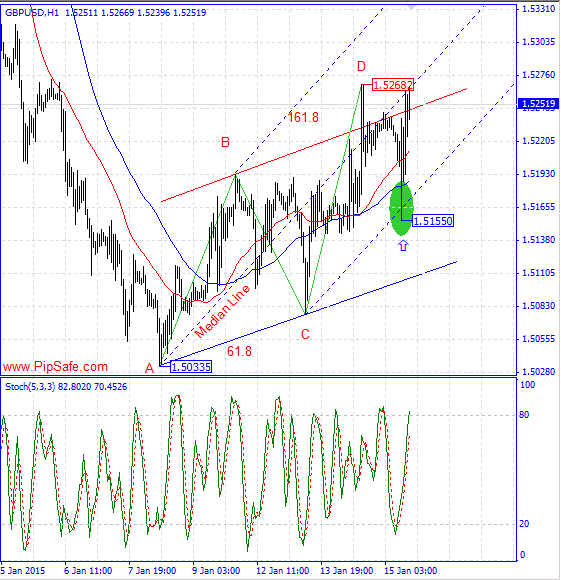
GBP/USD from 2014.07.04 is in a strong and without reformation descending trend that could experience a good price reduction could record the bottom price of 1.50335.Right now this bottom price is fixed(Daily TF) by an ascending candle which there are hammer candlestick patterns in this bottom price that shows the possibility of formation of a bottom price and then ascending of the price.With closing of the yesterday bullish candle, there is the potential for more ascending from the bottom price of 1.50335.
Stoch indicator in 1 H time frame is in saturation sell area that confirms the bottom price of 1.51550 and warns about the possible uptrend during the next candles.Generally according to the current situation and also price is in a saturation sell area , until the bottom price of 1.50335 is preserved, there is the potential for ascending of price and reformation of descending trend.
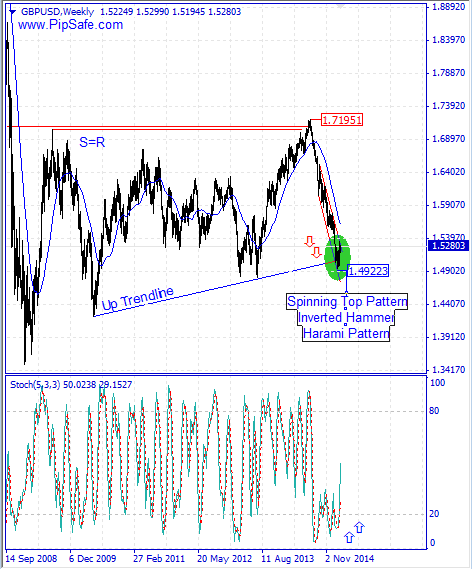
GBP/USD from the top price of 0.71951 till now was in a downtrend that Sellers were able to achieve the lowest price of 1.49223.One of the sellers’ targets was the round level of 1.50000(and Down Trendline) that they were successful in reaching to it and the price was not able to descend more by reaching to this level. Right now this price level is one of the important supportive levels in front of the price.
According to the recent strong descending, price is in saturation sell area and there is the potential for ascending and price reformation.
Stoch indicator is in saturation sell area and in divergence mode with the price chart in weekly time frame that confirms the price level of 1.49223 and warns changing price direction during the next candles.In the range of formed bottom price there are Spinning Top , Inverted Hammer and Harami candlestick patterns that shows the possibility for formation of a successful bottom price in continuing ascending trend.