Have you backtested what happens when these spinning tops occur?
Can only see it falling from here myself
I agree it’s looking that way seeing the spinning top formation
As of Friday’s close I still see GBP/JPY still in a strong bullish uptrend. However, recent price action across the 7 key GBP pairs has been weak, so I now rank GBP as having fallen to 7th out of 8 currencies, only JPY being weaker. As such, not a great opportunity to get long at this point.
Spinning Top is considered as a reversal candle. However, a spinning top itself does to make the price reverse. The very next candle plays a significant role. If the next candle comes out as a bullish candle closing above Spinning Top’s high, the price remains bullish. On the other hand, if the next candle comes out as a bearish engulfing candle, the price usually reverses.
Lovely trade mate as you say you wait for the full candle close from your zone .
Closing above or wicking isn’t rejection in my book
Damn, I missed this trade due to holidays. I had entered a couple of days prematurely but hit SL day before the drop, doh!
Good morning all. Happy to end the week on another TP hit!
GBPJPY reached our TP zone yesterday for a total of 780 pips for a 1:9 R:R. We managed to achieve this in 5 trading days, so it turned out to be a great trade for us. As previously mentioned we are still in an overall bullish trend , and as you can see price rejected from the multiple confluences of the demand zone and the moving average. Looks like it found a lot of support and we could either see a retracement here for more down movement or bullish continuation. Either way we are out with our profits and looking to the next trade. I will watch price over the next couple of days and come back next week with the next possible setup, enjoy your weekend all. GLIYF

1 Like
Great entry! The price headed towards the South with extreme bearish momentum and hit your Take Profit. This is what traders love to see every time they take an entry. Thanks for sharing the update.
Great trade. Your TP was spot on, seems to be heading upwards now. Look forward to seeing your next set up.
Good morning all, after our last trade on GJ hit TP we are onto the next setup. As price hit our TP zone down at demand we cans see that we got big rejection from that particular zone. We have since seen price re visit the supply zone from when we last sold. But it looks like the bull may continue and I think the next push may break the supply zone . So I am looking at a buy from this little demand just under where price is now. Hopefully price will visit there over the next few days and gather support to give us our entry. One to keep your eye on and be ready. GLIYF

Looks like a major HTF area at 174 ill be keeping an eye for sure
The level of 164.160 looks promising to hold the price and push it towards the North. However, the resistance above looks strong as well. Thus, I assume it may be a better option if we take a partial profit around that level and let the rest of the trade run.
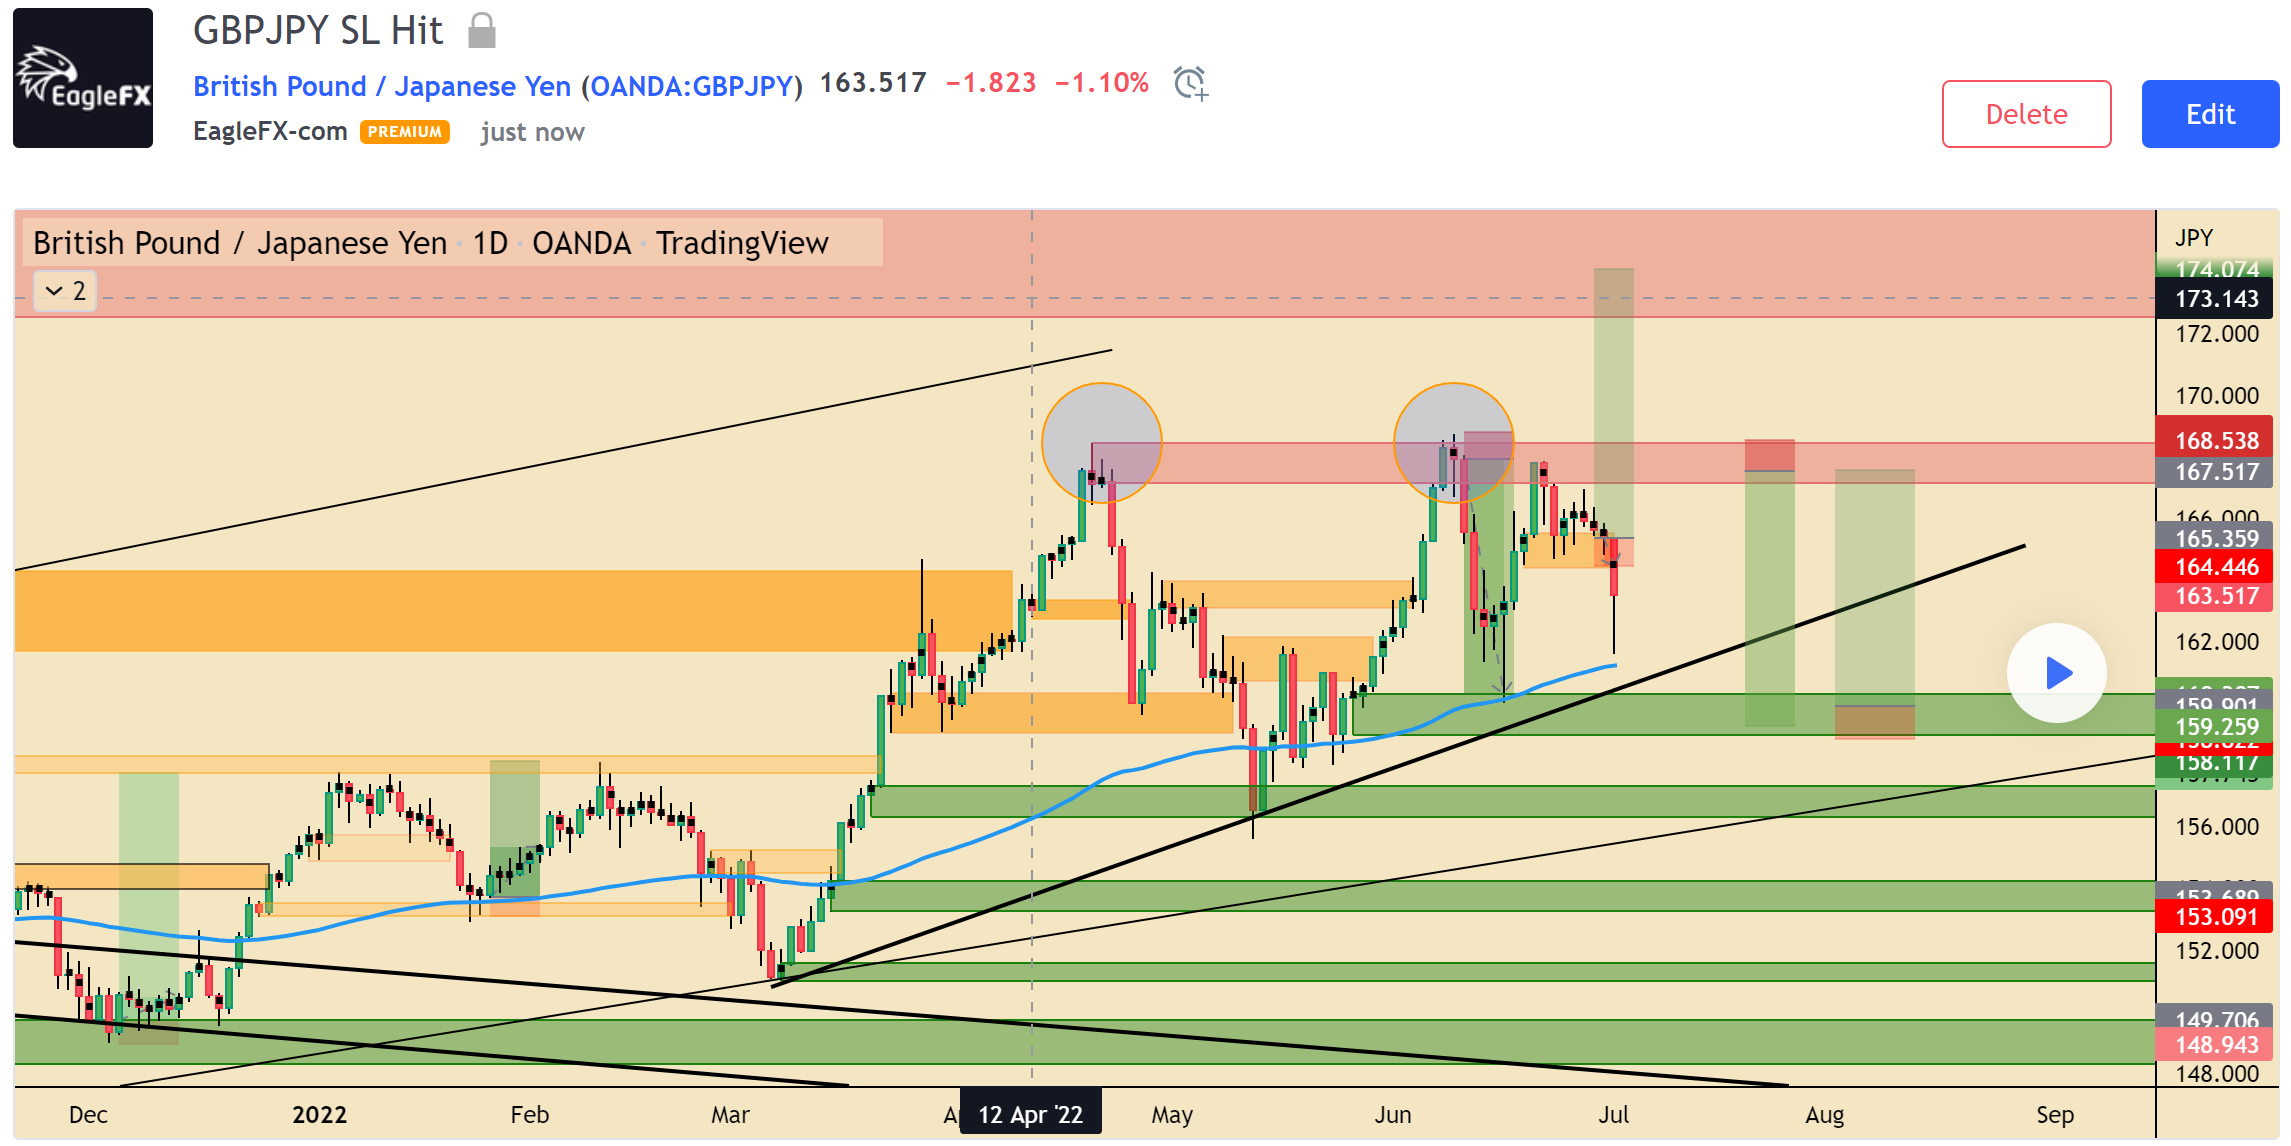
Good afternoon, hope everyone is having a good weekend. Just going over my charts on a Sunday afternoon and thought I would do a quick update on GBPJPY . SL was hit, I took the buy trade after Thursdays candle close, as we can see Friday just gathered momentum and tanked right through demand. It may be the sign that the bull run is coming to a slow end. Price action over the next week will tell us more on what we can expect next. But for now it looks like we could trade in this range. So I will look to sell again from supply above if we reach there, or buy from the demand below. ill update again this coming week after more price action. GLIYF
2 Likes
The marked resistance zone looks very strong. The price had rejections twice. Thus, a bearish reversal pattern may drive the price towards the South. I am going to keep an eye to go short from that zone as well.
Price is making higher lows upto that resistance, i fancy the ascending wedge pattern to play out here and go long on a break and retest of the top
Really like the way you have the HTF areas marked it really plays a key role for sure
The pair seems to have found its support at 161.430 in the daily chart. The price had a bounce at this level earlier as well.Thus, it may make a bullish move upon producing a bullish reversal candle.
1 Like
I was thinking the same, looks like its starting to stabilise on the HTFs
Couple of positions open now on gold and Bitcoin. Waiting for other setups on the other pairs. This week’s video out now head over and subscribe if you haven’t already. Have a good week all
