Hello fellow traders. In this article we’re going to take a quick look at the Elliott Wave charts of GBPJPY forex pair published in members area of the website. As our members know, GBPJPY Is trading within the cycle from the February 28th peak. Recently we got 3 waves recovery against 165.98 high . The pair found sellers at the extreme zone and made the turn down as expected. In the further text we are going to explain the Elliott Wave Forecast.
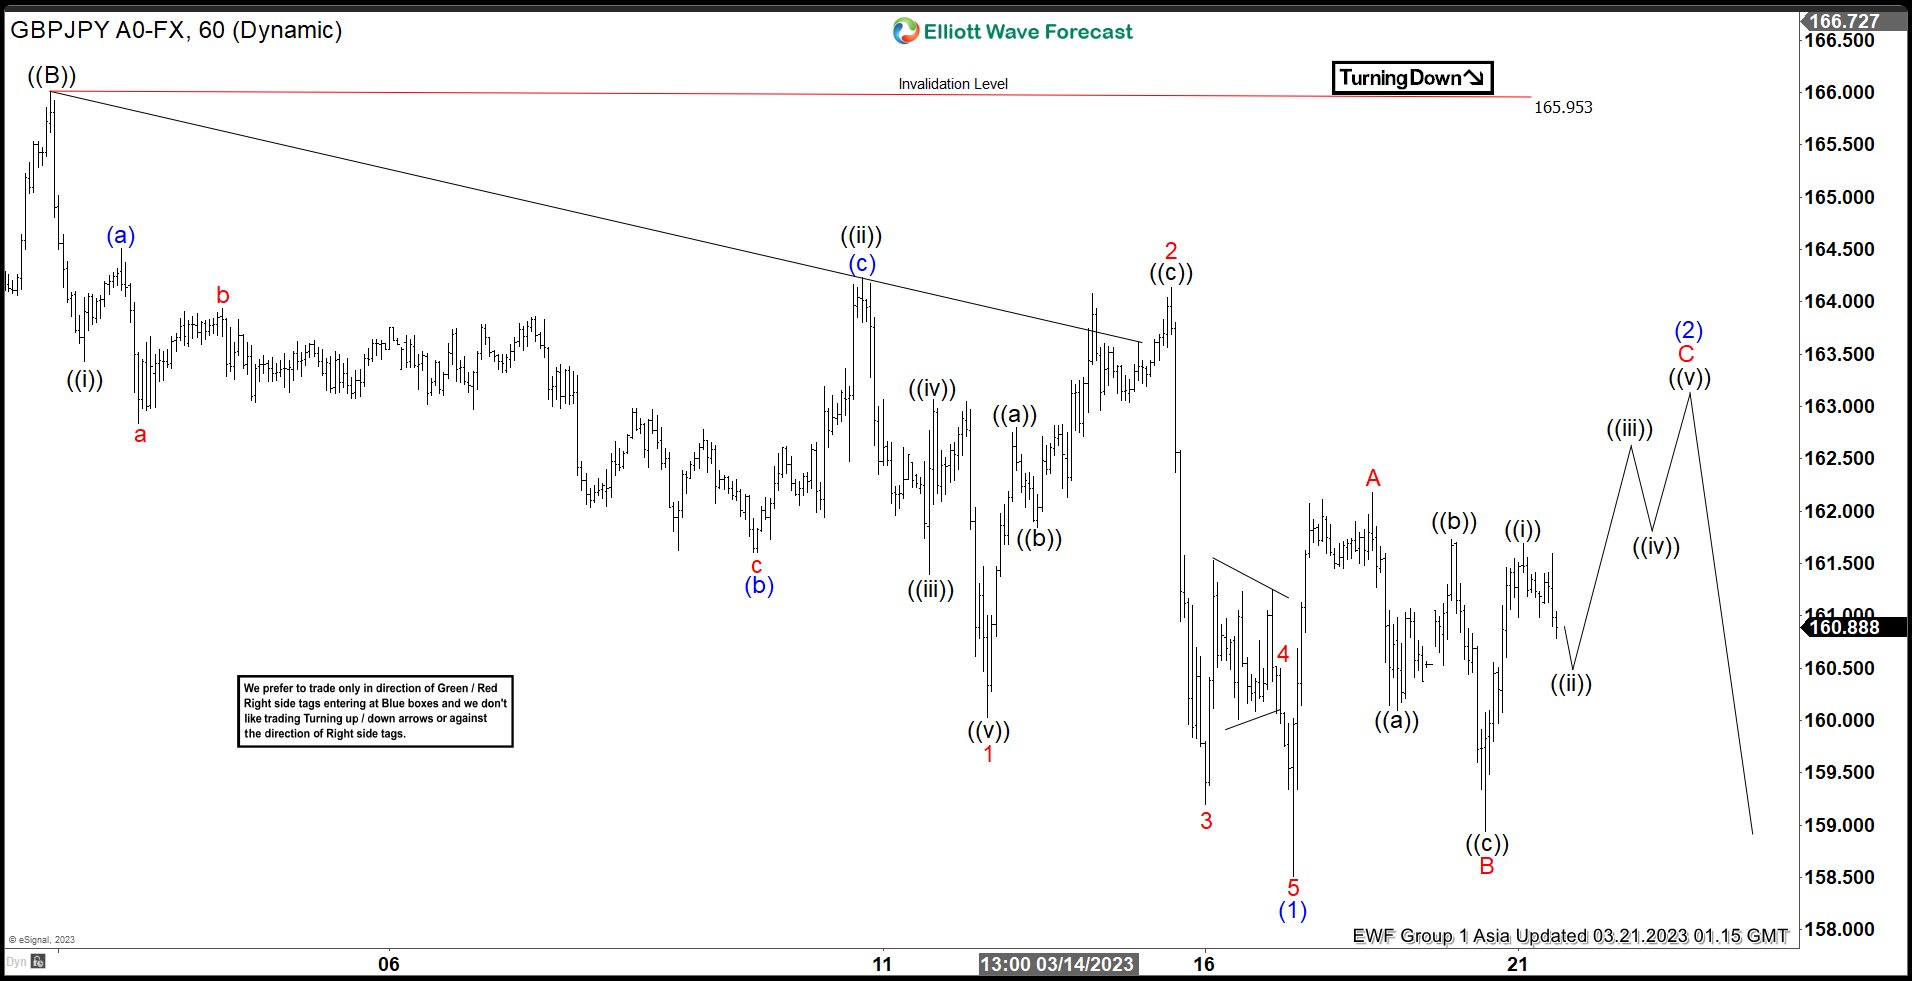
GBPJPY Elliott Wave 1 Hour Chart 02.10.2022
We are calling cycle from the 165.95 high completed as the 5 waves structure. Currently GBPJPY is doing correction against that high, which looks incomplete. We expect to see another leg up C red to complete wave (2) recovery.
You can learn more about Elliott Wave Patterns at our Free Elliott Wave Educational Web Page.
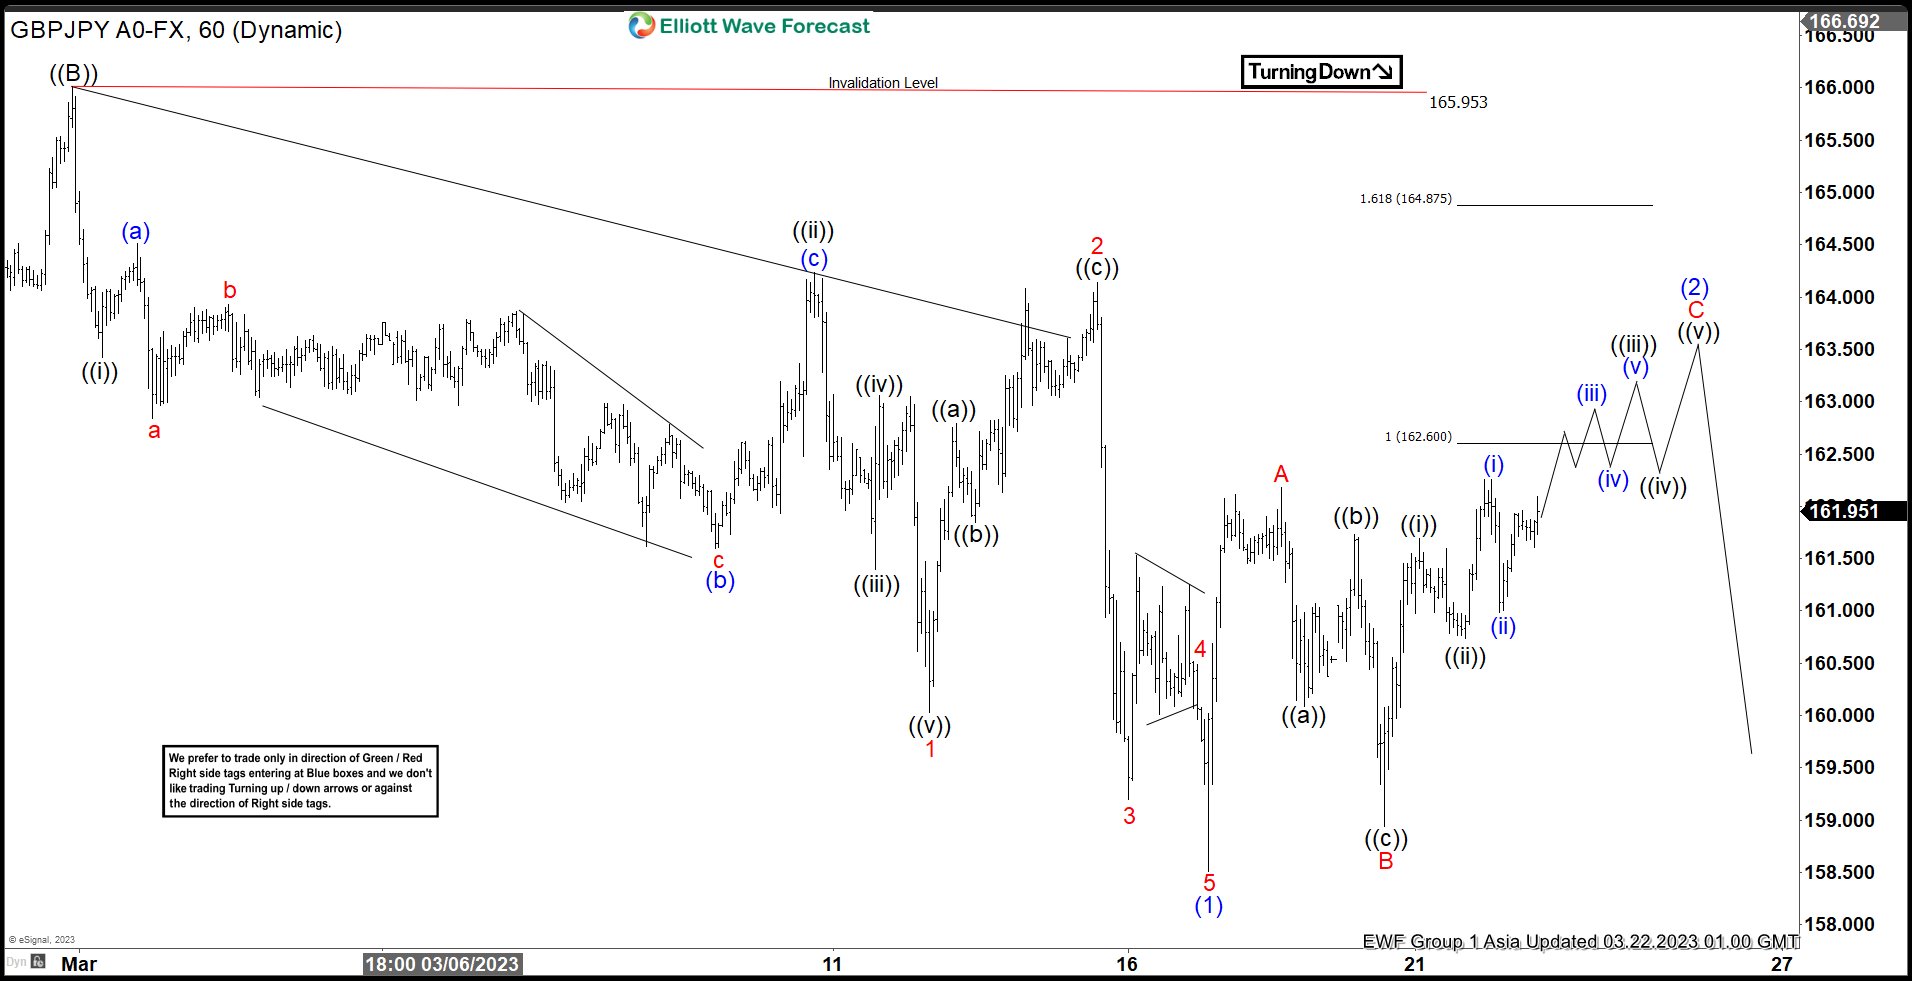
GBPJPY Elliott Wave 1 Hour Chart 03.22.2022
The pair has traded higher as we expected. It broke previous peak A red, confirming C red leg is in progress. More short term strength should ideally follow toward 162.6-164.87 area before turn lower takes place ideally.
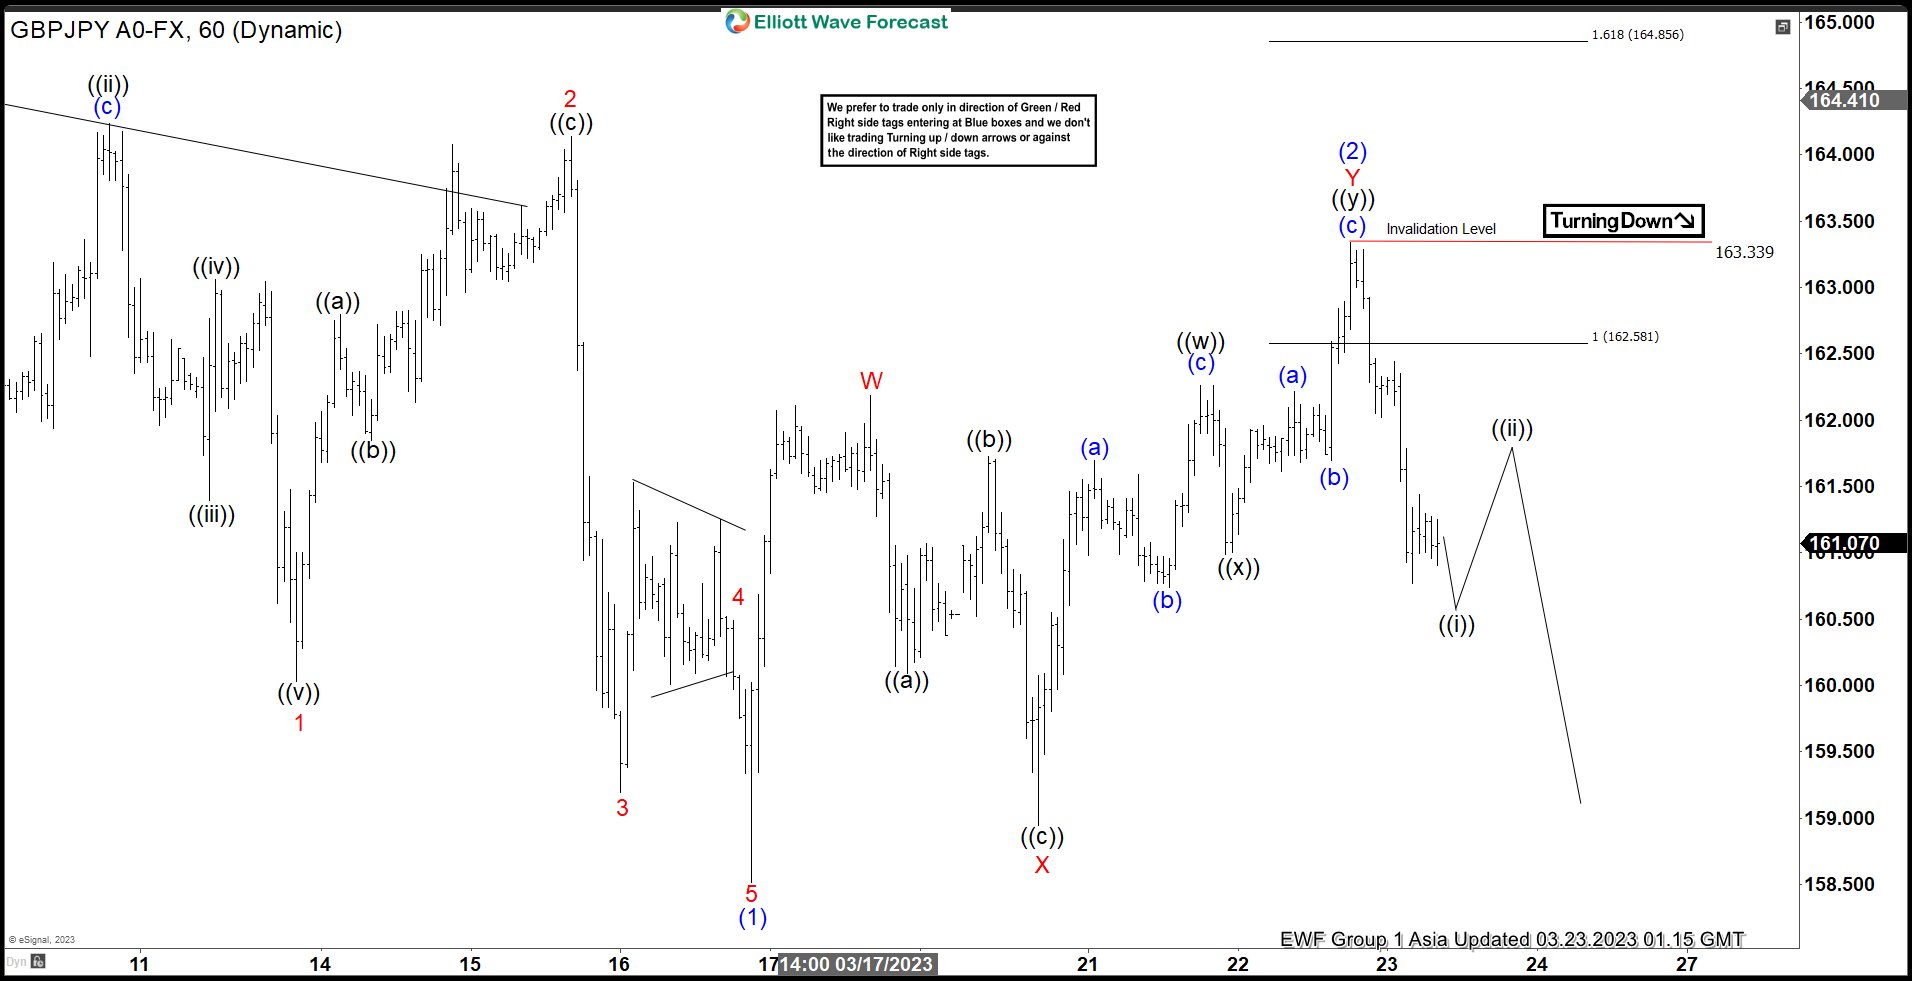
GBPJPY Elliott Wave 1 Hour Chart 03.23.2022
Eventually the pair made rally toward equal legs area 162.6-164.87 and found sellers as we expected. We already got decent pull back so we label wave (2) completed at the 163.33 high. As far as the price holds below that peak, chances are we are going to see further weakness. However , break of 03/16 low is needed to confirm next leg down is in progress.
Keep in mind that market is dynamic and presented view could have changed in the mean time. You can check most recent charts with target levels in the membership area of the site Best instruments to trade are those having incomplete bullish or bearish swings sequences. We put them in Sequence Report and best among them are shown in the Live Trading Room
Source: https://elliottwave-forecast.com/forex/gbpjpy-elliott-wave-forecasting-path/