Apologies @Ras4life, I tend to take too many things for granted.
I was describing what price and capital flow was actually doing, namely forming a bullish base to pause on before continuing higher. This is not the same thing as the actual pattern that was formed.
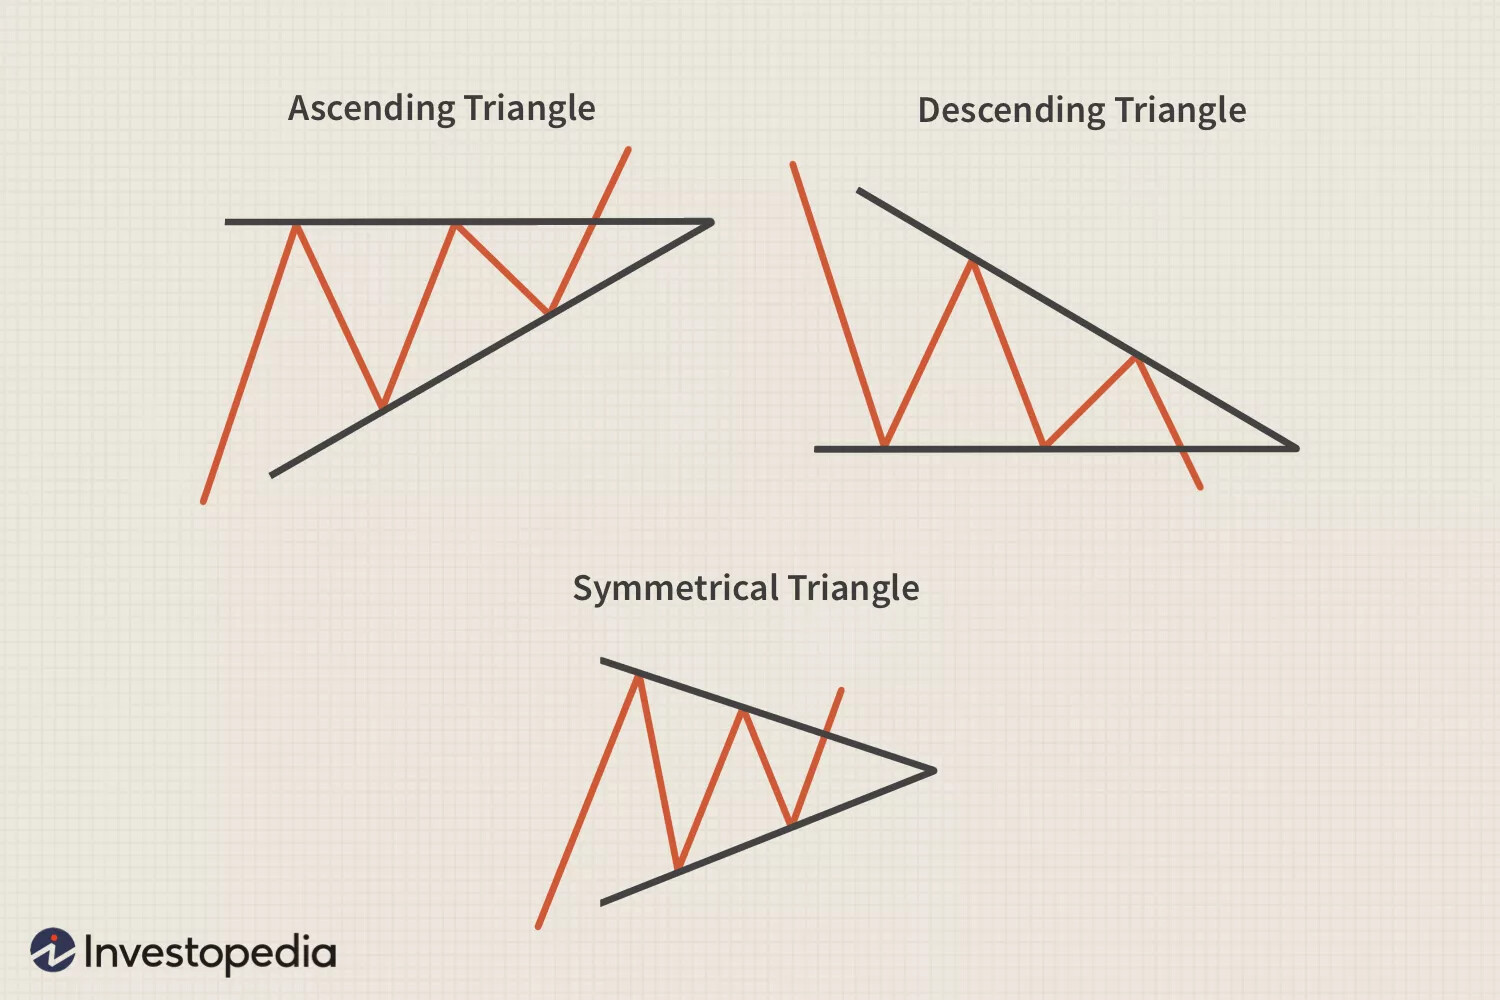
Just to be clear, there are many different bullish basing formations where price takes a pause before breaking out. This one in particular is called an ascending triangle pattern, but there are also bullish flags, symmetrical triangles, falling wedges, and more.