Australia agrees with Goldman Sachs on gold
Gold has moved in a $75 range for nearly two months now as shown on the chart as shown above. Goldman Sachs have a bearish view, contrary to many, predicting $1000 by the year end Are Goldman correct on gold? . On Friday, Australia’s Department of Industry joined them in their bearish view predicting $1105 in 2017 and by 2021, $1003. Australia, who are the second largest gold producer in the world, suggest that increasing interest rates lower the appeal of gold by making other assets more attractive, and expect that the dollar will rise as capital flows into the U.S. seeking higher returns. Australia expect their gold production to continue to rise until 2018/19.
I’m expecting gold to penetrate the [I]first support zone[/I] and test the 1,065 level in the next 2-4 months.
• If 1,065 becomes strong support, I will be a [I]cautious buyer[/I] as price rises above that level.
• If the 1,065 support level is broken decisively, I think the 1,000 price level will be tested. I then expect some penetration of the [I]second support zone,[/I] but I will not be a buyer within that zone.
I will wait for price to move back above 1,000 and establish 1,000 as strong support. If that happens, I will be a strong buyer above 1,000 as price is rising (as noted by the red ellipse on the chart).
Note: I do not trade in and out of gold on a short-term basis.
All of the above is part of a long-term bullion accumulation strategy.
Great analysis but ill take the opposite side here. Gold is in a giant wedge… moving up now until another breather around $1250… then hits around $1300 (and where the slope of the wedge would be) consolidates and we resume this very long term bull market (USD will depreciate too – why? b/c everyone thinks the opposite). Keep up the great work.
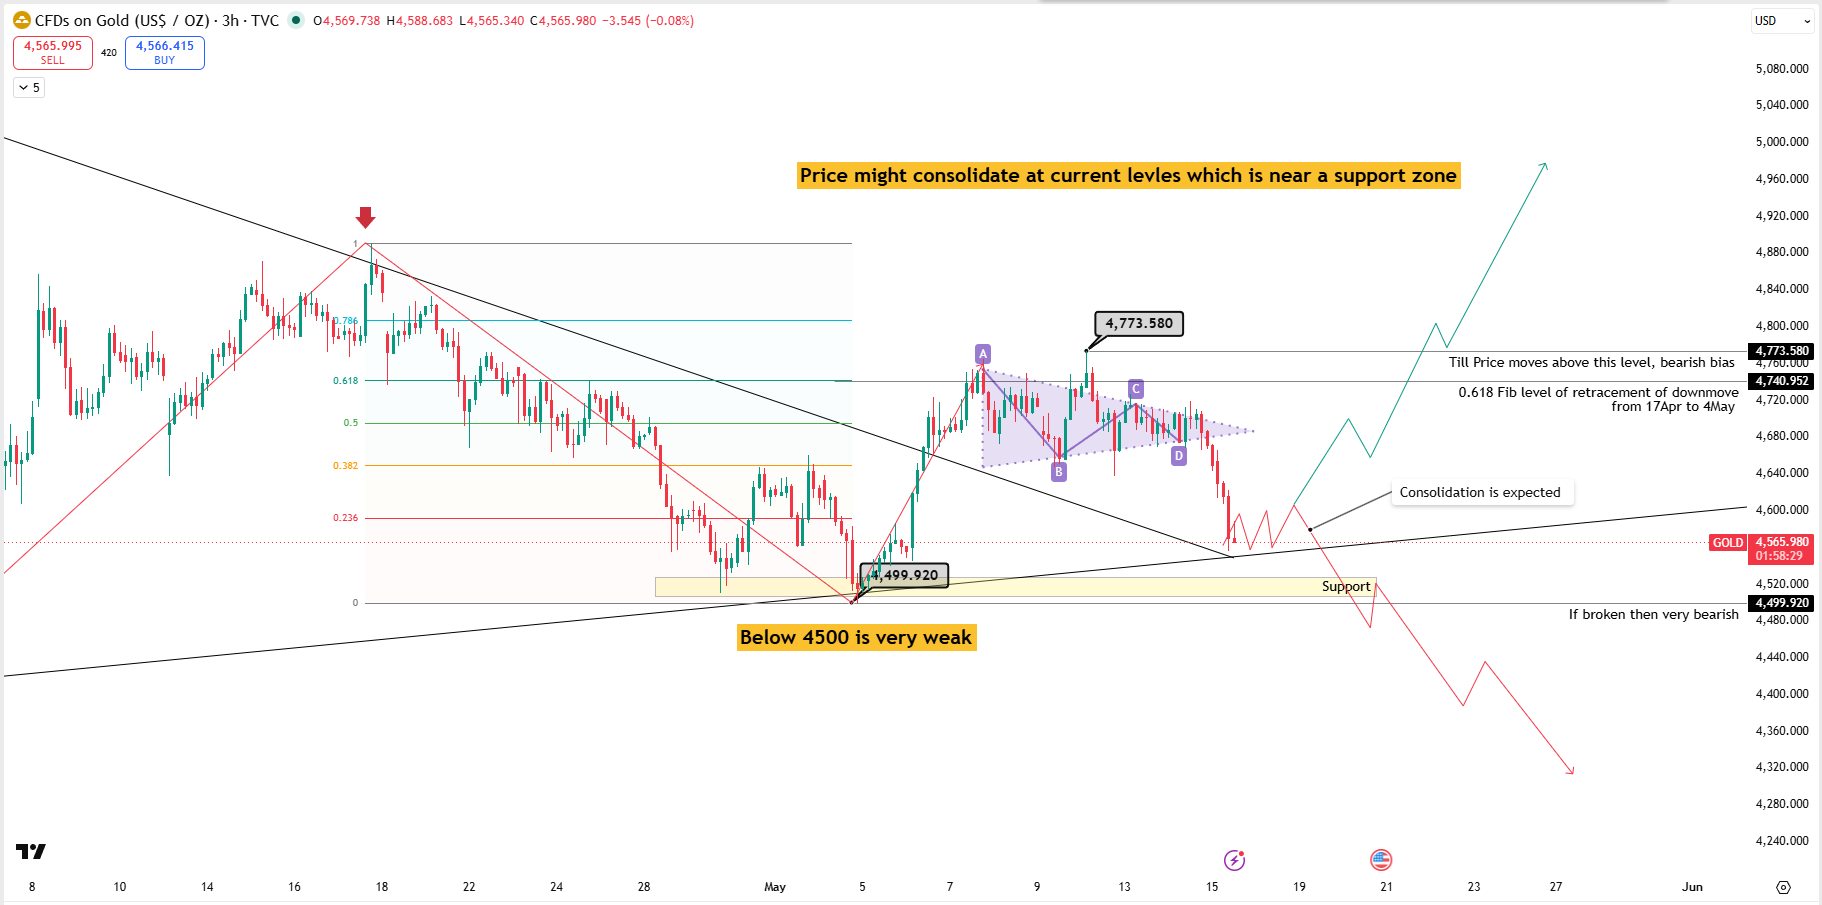
Gold Outlook for Near to Midterm & Levels to watchout
After a Downward breakout of the triangle pattern, that was preceded by a sharp up-move (of ~6% in 3-trading session), Price near an important support Zone of (Rising trendline and Horizontal Support), a sideways movement is expected before price Shows any Decisive move.
Point to notice
The Up move we saw couldn’t surpass the fib retracement level of 0.618 of previous downswing and fall back.
Levels
Important level on the downside is 4500, if taken out successfully then, clean sell signal would trigger, where as on the upside, level of 4775 is crucial, till the time price gives a clean breakout our outlook will remain bearish.
For Educational Purposes only, Not an Investment Advice
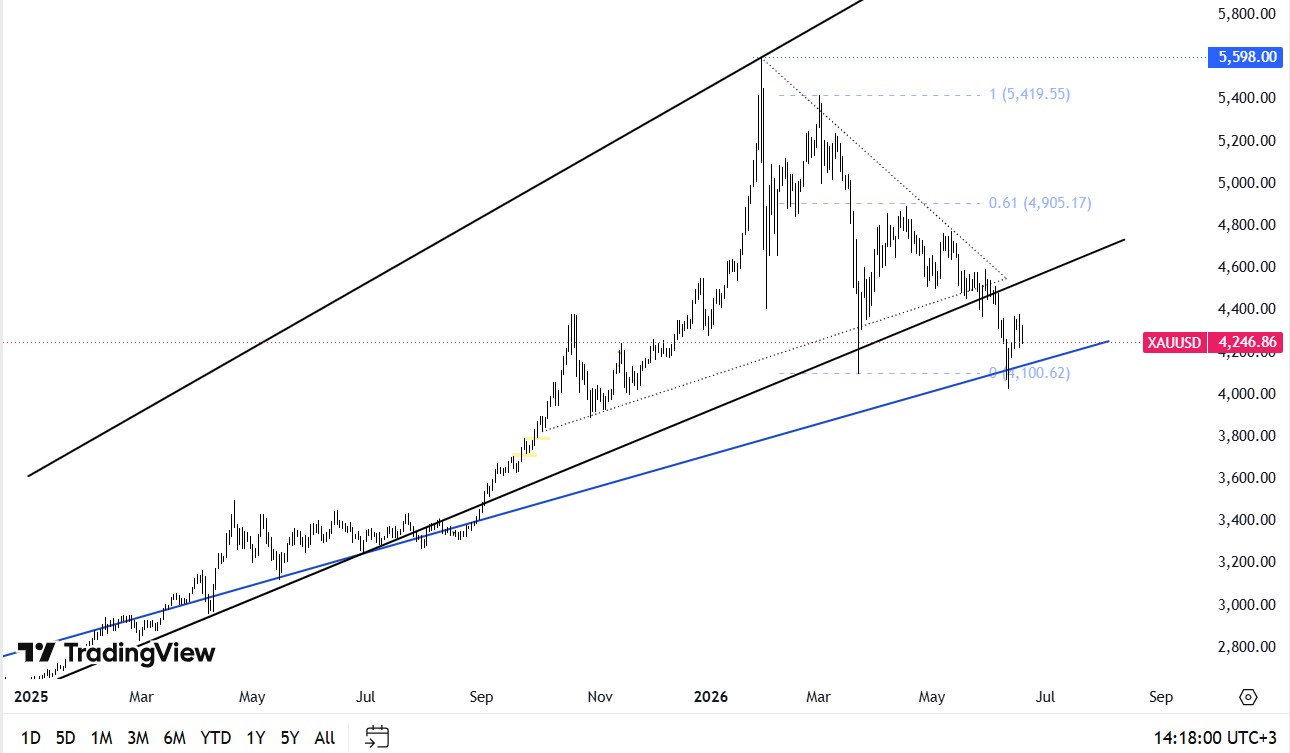
Gold is not giving a clean signal right now. The hawkish Fed hold is still supporting the dollar and yields, which keeps pressure on XAUUSD. At the same time, the US-Iran de-escalation and the reopening of the Strait of Hormuz reduced safe-haven demand, so buyers are not getting much help from geopolitics either.
Technically, price is still below the 50 SMA, so the short-term trend remains weak. RSI around 46 is neutral, while the rising MACD shows that downside momentum may be slowing. So the setup is not strongly bearish, but it is not bullish yet either.
For now, $4,350 remains the first resistance area. If gold fails to reclaim this zone, pressure may continue toward $4,260 and then the $4,100 area. A move back above $4,350 could ease the bearish tone and bring $4,400-$4,450 back into focus.
Gold is still supported by safe-haven demand, with Russia-Ukraine, Israel-Lebanon, and Hormuz risks keeping buyers active. Softer Fed hike expectations after weaker US jobs data are also helping gold, but rate volatility can still limit the upside.
Technically, the setup is improving, but it is not fully bullish yet. RSI is near 50, MACD is rising, and price is consolidating inside the Bollinger bands. Still, XAUUSD remains below the 50-day SMA, so the broader trend has not clearly turned positive.
The base scenario is sideways trading for now. As long as RSI stays neutral and price remains below the main trend filter, consolidation looks more likely than a clean breakout.
The bullish scenario needs a sustained move back above the 50-day SMA. That would confirm the improving momentum and align the chart with the supportive safe-haven and softer Fed narrative.
For now, the first resistance is around 4,160, followed by 4,165 and 4,173. On the downside, 4,146, 4,138, and 4,133 are the key support levels. A clear break above resistance could strengthen the recovery, while failure there may keep gold stuck in consolidation.
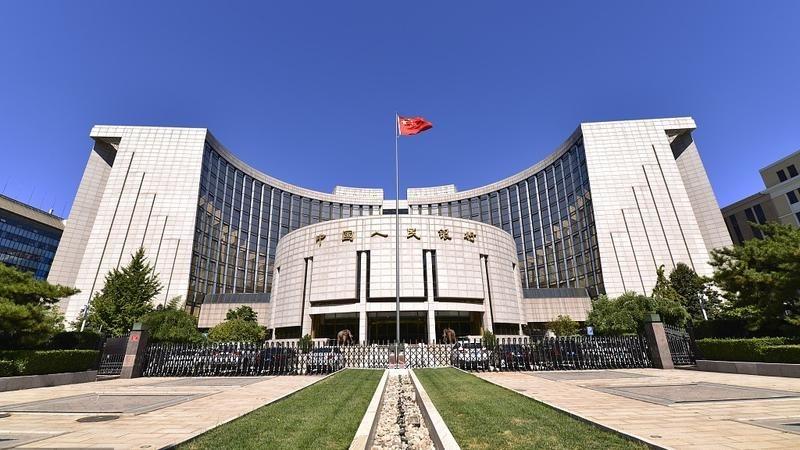
The People’s Bank of China increased its gold reserves by 480,000 troy ounces in June, extending its historic purchasing streak to twenty consecutive months. Total holdings reached 75.44 million ounces, marking the largest monthly acquisition since late 2023 and reinforcing Beijing’s commitment to reserve diversification.
This accumulation occurred despite gold plunging 12% in June, dropping below $4,000 an ounce for its worst monthly retreat since 2008. The decline was fueled by heightened inflationary risks stemming from the conflict involving Iran and a hawkish Federal Reserve stance. Wall Street firms like Goldman Sachs and Deutsche Bank reduced their year-end targets.