
Expecting a rally back down after reaching 1.05750. Price retracing back to a major support line. Expecting the market to retrace back to a major support level once it retraces downwards to a certain price level. This price level is supported on in several days. The view from behind should suggest a struggle once price retraces to the lower major level. Expecting market to reach this level tuesday or even mid wednsday as it has to retrace back over a hundred pips.
UI: -, ON support/ Off Resistance, -, -
EU:+, Off Support/ Off resistance , -, +/-
AU: +, Off Support/ On Resistance, - , -
Overall: +
Went short on till major support level. Took 30 pips but only half of my entry was triggered meaning I took half of the initial profit -__-
Price triggered set orders. Now shorting till the price point I stated earlier. I am going to follow this one closely as it hit intermediate day and week highs and lows.

Watch for levels to react to.
Levels:
- 1.04984
- 1.04721 (Level acting upon previous weeks major support level.)
- 1.04675 (Level acting upon previous weeks major support level.)
- 1.04447
The ones bold are the ones to be watched. I believe the AUS/USD will retrace back down meaning the market is still in bearish conditions. How? Has broken intraday swing lows.
Hm… When I was looking at the G/U pair today, I was asking myself, why no moves? Maybe I could have closed by 30 pip to 50 pip trades but I think I know why now. We have a consolidation. It is a relatively big one on the 4 hour chart. I feel like within this week, the prices will shoot for some support or resistance (here, I would assume for some resistance since the market flow is in a buy). I would be watching for this in addition to any other news event that would propagate this price pair.
AUS/USD is bullish at the moment. Watch for level 1.05777 as if it were to represent a bearish reflection pattern. I am hesistating or not to close this trade. I want it to test the 1.05777 level. I know that if it were to break through that level, we can go into a bullish market for maybe the next few days.
GBP/USD- This is a scary pair to be trading. I though I saw an opportunity to go long but it was not as I expected. It fell short near my close trade levels. Price seems to retrace for the time being. I only believe so on because 1.60007 was a level of previous support and resistance on the daily chart. I guess I will see it breaks the support level. I am expecting it to retrace back upwards the next day or so. IT might be hard to tell how far but only time will tell. Maybe it was the banks the knew people would be post their stop loss below this level since most traders would assume that it served as a previous strong support/resistance. I am assuming it blew out other traders positions or that they are in a disagreement with their trades right now. I am hoping it was just a placebo.

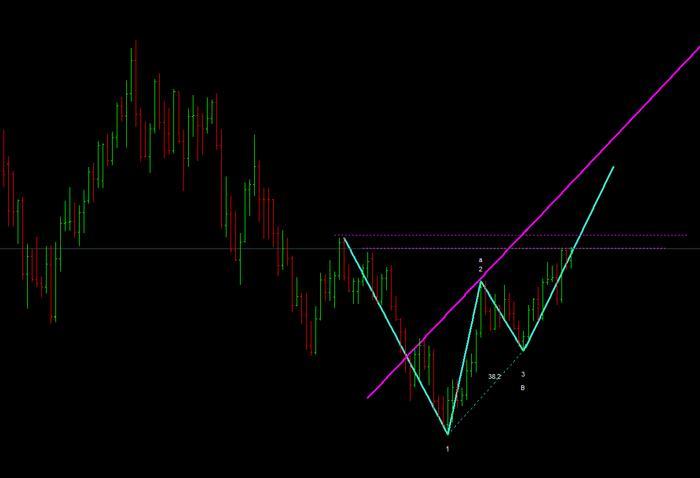
what currency pair is this one. there is no information other than a gartley/bat pattern is in formation.
USD/JPY 15 min
My decided not to share my complete analysis but rather put it in a word document.
thats fine for me all I wanted to know was, that which currency pair was it. even if u don’t write about ur analysis . ur chart is speaking itself, that what u are after.
Took 45 pips but through 3 different levels. I felt this trade was too good to be true. Look how it rallied back down.
I began confirming the directional bias of the market before entering the market. I will be buying the market. I still believe that the market will still go up. This can all change if the resistant levels are not respected. Regardless of that fact, I am bullish. I have two entry points. I dont know if market will respect those points at all because I would like to see a decline in market price before entering. Two orders. 4% total. 1.34004 and 1.33918. I did however make a mistake when taking a order. I was placing a limit but but forget it just clicked market buy. When I bought, I was intending to get out when the market is bullish. At the moment, it is really strong bullish. 1 active order, 2 pending orders.

I honestly dont think the sister pair is ready for a pull back just yet. It has broken the previous support levels and I believe it can possibly come back down and retest another support level, 1.56895. This level is the level where i believe price may want to reach for after disrespecting the previous support level.


Remember, be cautious trading this pair because I believe this pair can retrace anytime this week!

do u use some software because some of lines suggest so.
again same question, not sure what instrument or what set up u are showing here?
Hey Nisar,
This is EUR/GBP btw. I dont use any software at all. The only indicator I use is Asian Session Indicator that could be found somewhere from forex factory I believe. It was from really long thread on harmonics and gave a bunch of indicators. I chose the ones I thought would be useful.
What I am showing here can be quite confusing. It is just trend lines indicating fractals in the market. They show strong market moves that could potentially pivot the market into a reversing market. I trade it as a temporary measure and trade some long term. However, this is combined with counting waves. I am looking for the next fractal to form or you can say pivot. I am looking for the end of wave 3 and the start of wave 4. The indications of wave four forming may be strong as levels of resistance is being approached. This pattern could just as easily rally up to a certain fib level and be established as a Bearish Shark Pattern. However, I have strong indications of it not rallying that far up because you can see from a higher time frame analysis that several resistance levels are right above and below that fib level. I am just considering the possibilities just like any other traders.
Like I said above, it might be a bearish shark pattern but I tend to void away from this pattern. The most profitable and attainable patterns I have ever seen in trading is the Gartley and Butterfly. I trade those exclusively and heavily. Crabs and bats I have no care for them in the world. They are impulsive and react in a uniformed way.
I want to note to those who read this thread. Asian session has been quite volatile these past few days. I hope your guy’s transition from the london/ny have been serene. I began to notice how during london/NY it is almost passive trading trading these two pairs. London/ny = consolidations. Asian sessions= Volatile. My advice is to prepare during the london/ny and anticipate the asian session. React when all things fall through.
Had several midterms this week and have been slacking off on this passion!
Here is a complete cycle of the pair. I believe the pair is still tradble at this point but you must be careful as to where you place your stops and take profits. Here is an image of my EUR/USD

Following this image is on a higher time frame analysis. I have my tp set a the 1.36192 level- just on the safe side. I prefer to take my profits a little early because I have no prediction as to where the market will go.

I am expecting the Euro to fall later this week which is why I am setting my Take profit a little early. Why? Because the dollar has been rising and the year yields show strong interest in the direction and flow.