Good Morning All,
Great trading TWHM! I gave back some pips yesterday and Wednesday so I’m still yet to reach my target. Missed all of that lovely drop, but Next Trade!
Have a great weekend all!
Good Morning All,
Great trading TWHM! I gave back some pips yesterday and Wednesday so I’m still yet to reach my target. Missed all of that lovely drop, but Next Trade!
Have a great weekend all!
Indeed PipDoctor! Rest well for next week.
Interestingly enough, there was a rising support trendline on the GU on 4H. price had touched it twice and then bounced, so I was watching as it steadied around the trendline for the 3rd time and I almost placed a buy order. fortunately i got distracted by the GBP/JPY setup and forgot about the GU. That would have set me back from my target big time!
Hi all,
Firstly can I just say a big thank you to all of the contributors of this thread, I have been away from trading for around 4 months now. Not intentionally in fact far from it, unfortunately just too many work commitments, my feet really haven’t touched the ground over the past four months but hopefully over the coming months I should have a bit more time to contribute to a more worthy cause (Trading!) Without giving all the boring details I basically work full time, work part time for myself and also studying full time. I’ve just got two more exams next week for this year but then I should be able to put that aside until late September  Your probably thinking well if your soo busy well why are you trying to get involved in trading, that’s exactly the reason why. Not asking for an easy life or anything but just a bit more structure and maybe weekends off would be nice
  but I’ve got a long long way to go yet.
And yes I can certainly level with TWHM and pipdoctor in terms of looking at the charts after a break… it’s like a foreign language again!!
Anyway’s thanks for the latest update on the trading method bank, it all makes sense and it’s another tool in the box. Looking forward to seeing more examples as they come up on the charts and I’ll be around to ask lots of silly questions
Good evening everyone!
Welcome back Pips your Daddy.
Just checked my Charts for the week ahead (trying to sneak in as much chart time as possible).
2 trades I am looking at.
first of all, loooong term trade.
Eur/Usd Monthly! coming up to a PVSH fractal. will wait for confirmation that it will either bounce from that level or go further down. I’m leaning towards a short trade as it seems to be at the top of a range, but who can be certain. If it goes, we could see a hell of a trade.
more short term:
USD/CHF 4h. CHF has been going from strength to strength, but I see a lot of fractal lows forming. we could see a trend reversal some time, or this could be a consolidation. I dont know which way this could go and really I dont care, I just want to be there when it goes.
Putting it to bed now, but I’ll be back tomorrow.
Can anyone help me with this, this is driving me absolutely barking…
Whilst reviewing this thread I was looking at one of bank’s charts and noticed that although I am using the same charting platform (vt trader) my high/low/open/close’s are all different which completely changes the look of the chart and is massively annoying. I have had this issue before but it was due to using diff trading platforms. I purposely swapped to vt trader to overcome this and it has always shown the same charts as bank but now there messed up again. I have posted the two charts below for comparison.
The Chaos fractals are one of the important indicators with this method but due to different opening and close prices which I have come to the conclusion must be to do with different chart times, the chaos fractals don’t show properly either.
Maybe I am being real real stupid but I have tried changing the time zone within the settings menu which doesn’t make any difference.
Any help is appreciated and also if I am being stupid please enlighten me
[B]Banks original chart[/B]

[B]How I see the same chart[/B]

Morning all,
Anyone see those tweezers on USD/CHF? what the heck was all that about?
Anyway,
PYD, not sure what is going on with those charts?! I was going to suggest about the timezones, but you aready checked that. I dont know how they could not be, but are you sure your fractals are being applied correctly?
Morning TWHM,
What TF are you looking at for USD/CHF?
In regards to my charts, they are seriously annoying me now! back when I was last trading at the beginning of the year I must have wasted days and days if not weeks trying all the different platforms under the sun. They all worked but I am assuming they all use different server times which is why some packages start the 4 hr and daily bars an hour before or after other platforms which can paint a very different picture of the market.
I have come to the conclusion the best charts to use are the ones based on new york close (EST) or (GMT-5) and the only platform / broker I could find that offered free demo was cms / vt trader. It was all fine and I’m convinced it must be something to do with when we switched to BST back in March (I’m in the UK)
The fractals are definitely working as they should as when I flick down to the one hour were back in business and I’m seeing the same as the rest of the word (I have to be because its hourly I get a new candle the same time everyone else does) The fractals don’t appear as the candle patterns I am getting are not valid for a fractal high / low as new candles are starting too early / late and distorting the charts.
I have tried signing up for a demo and choosing location as U.S instead of U.K but still the same ;(
Even tho my charts are physically correct (they are not lying to me) they make it very hard to read the market… I bet it’s the simplest thing ever that I’m missing
Good Morning All,
I think I slept for twenty four hours literally :27:. Was so tremendously exhausted and had a very hectic weekend. Great to see everyone. Welcome back PYD! I was looking at your VT Chart against mine and I have no clue why they are different. Certainly those two charts would allow one to take different approaches. My VT Charting was down for awhile, I wasnt able to see the current H4 and Daily candles. Don’t know if that was the cause.
Eyeing a possible PVSH reverse trade on H4 EUR/JPY @ 115.17 from June 13, May 17 and May 12 PVSHs. Immediate resistance at 115.66 Old PVSL (counter long setup).
Also for EUR/USD H4 Old PVSH from May 11 @ 1.4324. Weekly PVSL also at this level. Immediate resistance 1.4378 PVSL (counter long setup).
Good morning all!
Getting my first look at the charts as I was out of town all weekend. Welcome back PYD, good to have you. I don’t have any suggestions for your charting problems as I am not very technical…I am doing a demo on FXCM, but thinking about using VT when I go live so I may start a demo with them soon.
I apologize in advance, I dont have time to post charts so just going to post some levels I’ll be watching!
USD/CAD 4H. We’ve got a new PVSH at .9774 there are also 2 or 3 old PVSLs at about this level so a close below could signal some decent selling.
I’m also long on GU, with the last PVSL that formed at 1.6245.
Good start to the week, hope everyone’s battery is recharged!
Old PVSL short setup at 1.6316 on GBP/USD.
Long EUR/USD off Weekly PVSL and H4 Old PVSHs.
Will add to my position with each close above the levels shown below:
Hi all, thank you all for the warm welcome back. It’s nice to feel part of something
I have spent the whole day (really, the whole day) trying to fix vt trader but still no further ;( tried uninstalling, reinstalling, upgrading, restoring. changing this and that and im stumped! The very latest version I cant get to work at all no matter what. I find it quite amusing now to be honest. I have just sent an email to cms tech support so we’ll see what they say and I’ll let you guys know. HHmmm maybe that’s should have been my starting point to begin with but nevermind.
Bank can I ask a big favor from you, please can you click on your latest 4 hour candle on any chart and let me know what time the candle started (it shows on the bottom left corner of the screen when you click the candle) and also note down what time you checked it. This should help me work out what on earth is happening with mine.
Very much appreciated. Thanks
Hi PYD, You taught me something there with clicking the candle and seeing the info in the bottom left corner of the screen. I just clicked the current candle at 11:00am EST. It shows that time the candle will close (12:00pm), not the open time. Hope that this helps.
Stop moved to BE. We are fading off the potential buy levels.
Long EUR/JPY off 115.17 PVSH Reverse trade level.
Many thanks bank, this is really weird. My next candle is due to start at 12:00 EST also, so how can they still be different… anyway off out for a little while. More investigating when I get back. Thanks all
Well gents, it happened today.
Today I took a big hit. A hit to the tune of -80pips. :mad:
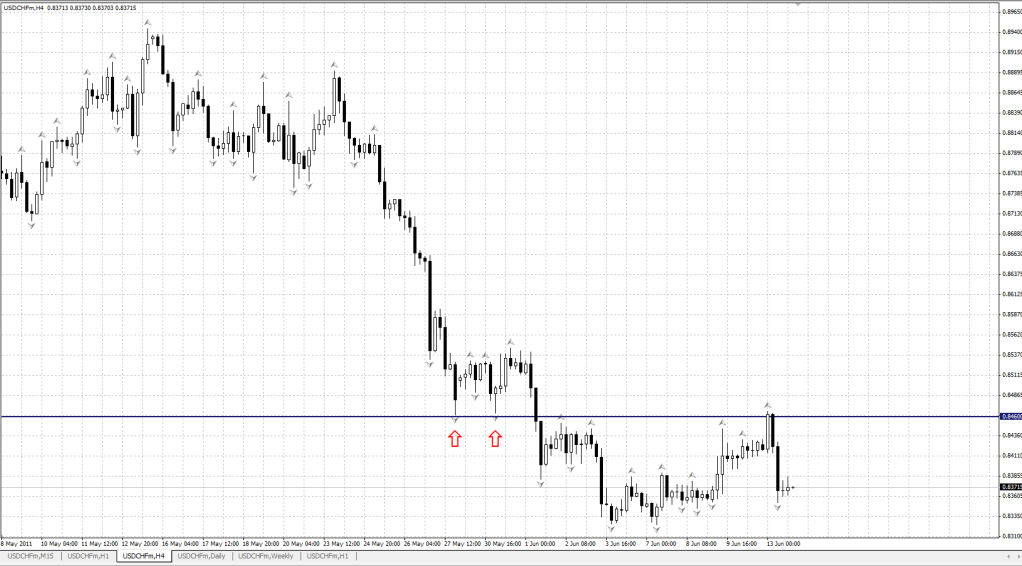
USD/CHF: Last night I was eyeing up this pair for a possible trend reversal. I spied a a lot of support going on on the 4H, and I thought “this could be it”. but I’m not that much of a fool to go jumping in straight away- I set a long limit order at the 23% fib line on the daily chart ~0.846 area.
This morning I get an email alert to say that the order has been triggered. “I am one bada** trader” I thought. I get home and :33: something has gone horribly wrong. I see a high of 0.8466 on my charts, followed by a super-mega-death-defying drop. My stop had been hit and I felt like I had been kicked around like a teapot in a bull infested china shop.
The recovery:
Fortunately I am still in the game, and still well above BE (but last weeks target might as well have not bothered).
Looks like I’ve still got some newbie kinks to batter out, and I dont feel like I want to drop trading- quite the opposite. I wish for the day I can spend more time on the charts, because this current routine sure as hell isnt working.
Cheers,
A (demo)Broke TWHM
You got hit by the attempts of traders to smack EUR/CHF down under 1.20 again. There was a lot of overnight put options in EUR/CHF for 1.20 being bought which was weighing heavily on Swiss pairs in general throughout the morning. But once they couldn’t get under the 1.20 level a pile of short covering went on and up we went later in the day in all the Swiss pairs. Just one of those things that can happen I guess - have a look over your trade and see what you can learn from the loss and then move on to the next setup.
The only thing I’d point out is that there was some previous swing lows on May 27th and May 31st right at the level that you were entering long at - it possibly would have been better to wait for the probable resistance there being broken before going long. Personally I don’t trade the Swiss pairs much myself as I find them a bit uncooperative and feel like I can usually find easier trades in other pairs.