This post is a continuation of my discussion with @MattyMoney about how “beautiful charts lead to beautiful trades”, i.e. better analysis and chart reading skills leads to more profitable trading.
TL;DR: I struggled for a long time because I thought the key to letting profits run was having the right discipline & patience (trading psychology) after entering a trade. This was so wrong – the key to letting profits run starts with analysis and chart reading long before the initial trade entry.
The Precious Metals Secular Bull
My real portfolio has been positioned in precious metals and commodities since 2020 - 2021. Back in July 2024, I started a “paper” trading account to practice and improve my entry and exit timing. (I hold positions for years with very little buying / selling and need the practice ![]() )
)
This is a screenshot of the paper account back in Oct 2024 ![]()
Note: I started this account in July 2024 and the screenshot above shows the portfolio appreciated 39% over those 3 months.
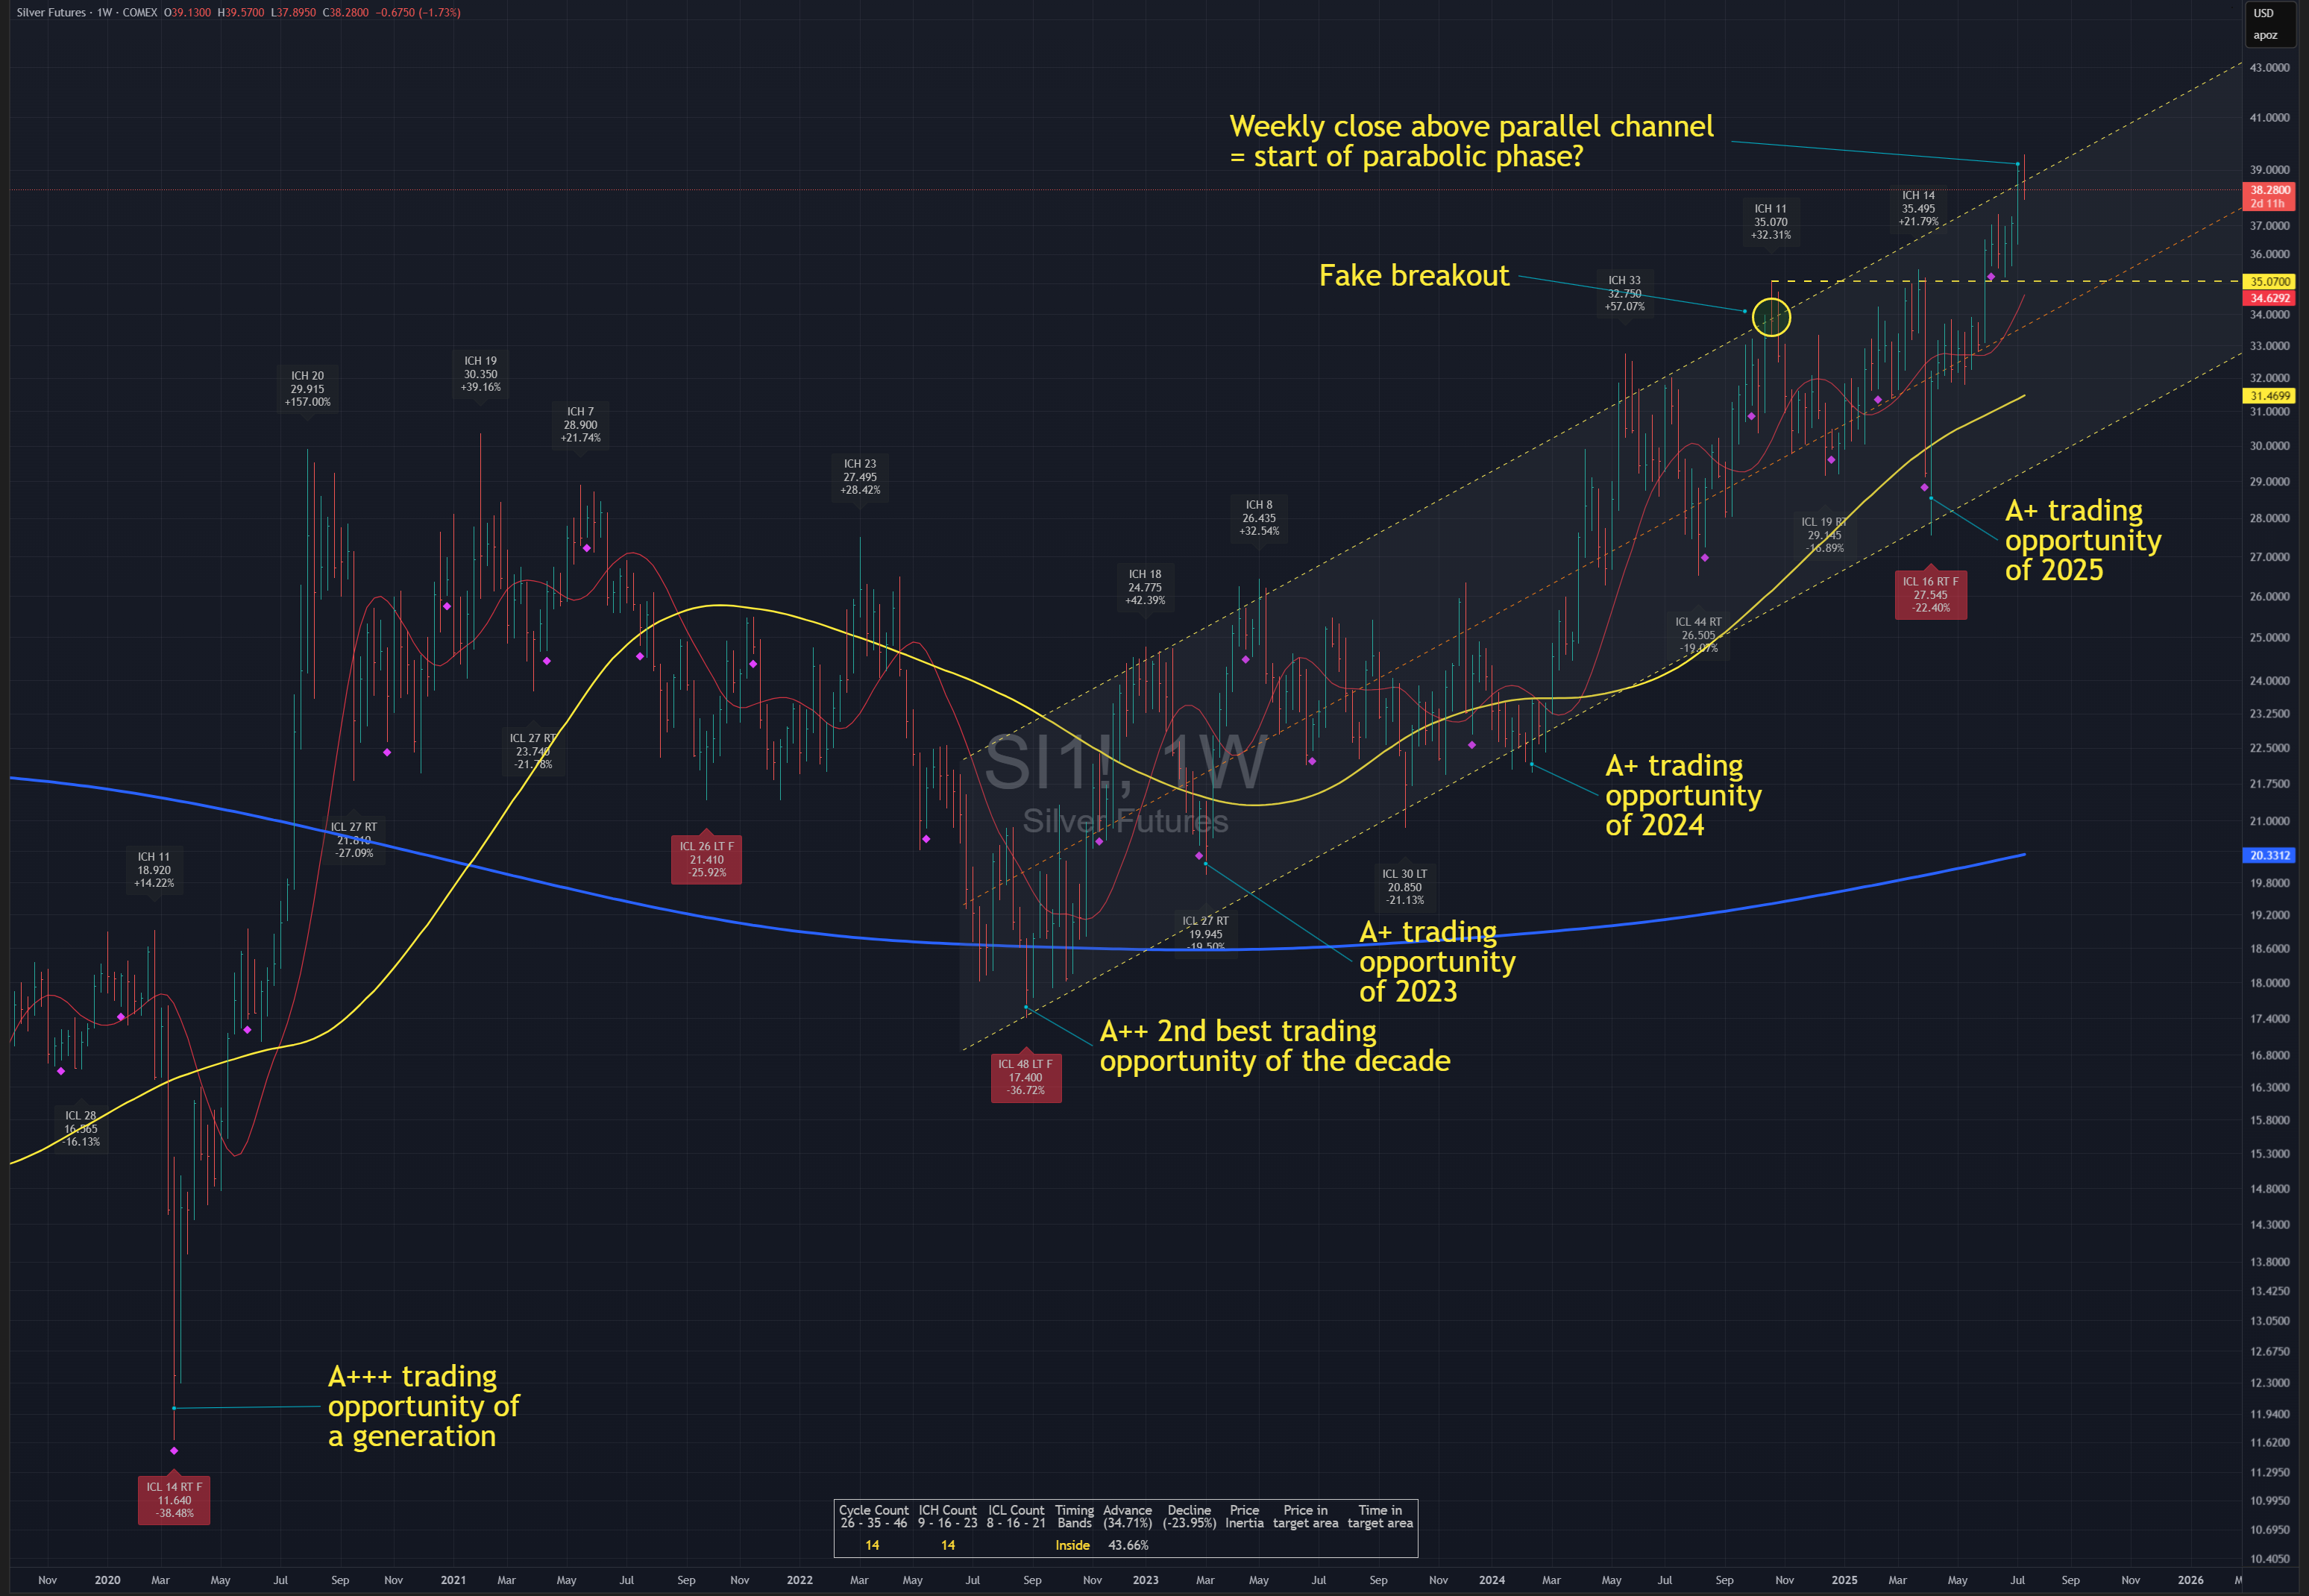
At the time (yellow circle in weekly chart below), I was expecting silver to make its historic breakout, but it didn’t happen. Instead silver consolidated for 6 months(!) before offering the A+ trading opportunity of the year in April 2025 ![]()
The key to letting profits run is understanding the risk-to-reward potential of the opportunity before entering the trade.
In the chart above, I highlighted the best trading opportunities in silver since the start of the secular bull. I personally look for these extreme price levels (above / below very long term SMAs) where price will not come back to for a long time, if ever. Knowing I caught the entry of the year / decade / generation gives me more conviction, discipline and patience than “trading psychology” ever could.
Here is a snapshot of the live paper account after loading up with more positions at the A+ trading opportunity back in April 2025, showing equity gains of +765% over 12 months:

As you can guess, this is not a smooth gradual upsloping equity curve. Instead the equity curve was in the red for weeks, then rose +40% after 3 months then stagnated and fluctuated in a +25% to 40% range for 6 months through the consolidation phase until the A+ opportunity provided massive gains over the last 3 months. And this run still has a ways to go.
I understand that my way is extreme compared to most traders, so I don’t advise anyone to do what I do. However, I do advise every trader to prioritize improving their analysis and chart reading skills, it’s the key to success.
I hope the above also demonstrated what I’ve stated before – that long term trading can be just as profitable, if not more profitable than short term trading, while providing all the time freedom a trader can ask for.