what do you mean, “the bars are formed by price and not by time.”
Can you post your indicators I find them interesting and would like to play with them.
what do you mean, “the bars are formed by price and not by time.”
Can you post your indicators I find them interesting and would like to play with them.
Renko bars and Range bars are formed only when price moves up or down.
If you set them @ a certain value (pips) then a new bar will be plotted only when this (pip)value is reached.
Google for it if you want to learn more about it.
I don’t use time chart anymore for a long time !
If you feel interested later on, i can introduce you to this system.
Gilbert.
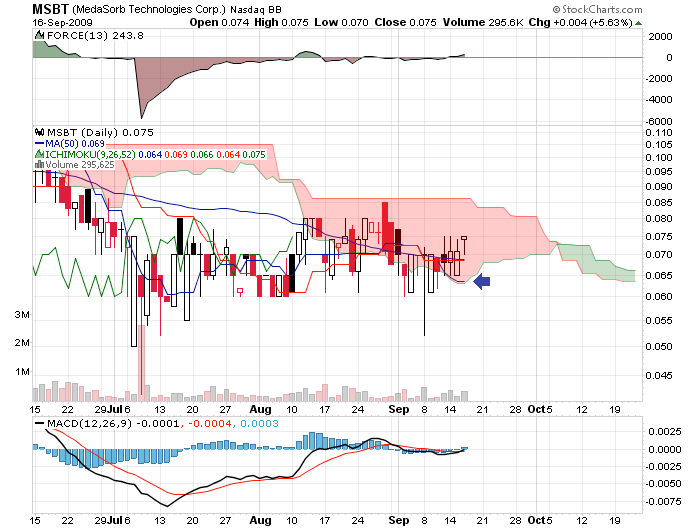
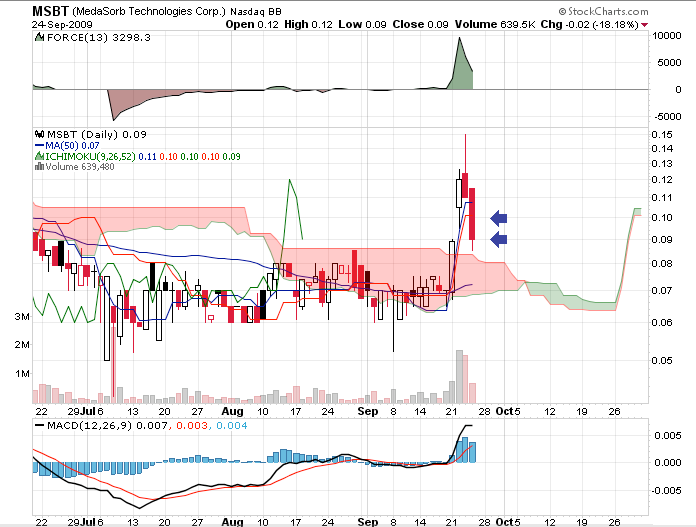
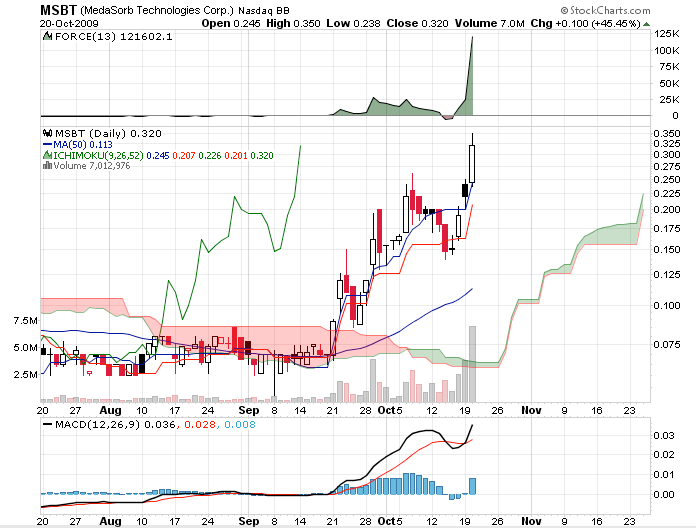
These are my buy signals. This is not for trend trading using the traditional ichimoku method. This is for short term, quick money.
In/Near the Kumo Buy Signals
1 - On Alert - TS has moved under price action now and the bottom of the cloud is acting as support. A bucket appears to be forming at this point.
2 - Strong Buy - The bucket has formed and the closing price has broken through the top of SSB cloud resistance. TS and KS are both pointing up.
3 - TS and KS are both behind price action a bit so we have to be careful about taking a position here. TS and KS have both made it out of the cloud but we should only be watching at this point as it’s very risky to get in now.
4 - As you can see a down day after a little surge in price resulted.
5 - Closing price has fallen below KS. Waiting for reentry signals.
6 - Buy - Closing price has gained now support from TS.
7 -Strong Buy - As long as price action stays above KS we are holding here.
8 - Still holding - Secure some profits as price action has moved significatly ahead of TS/KS
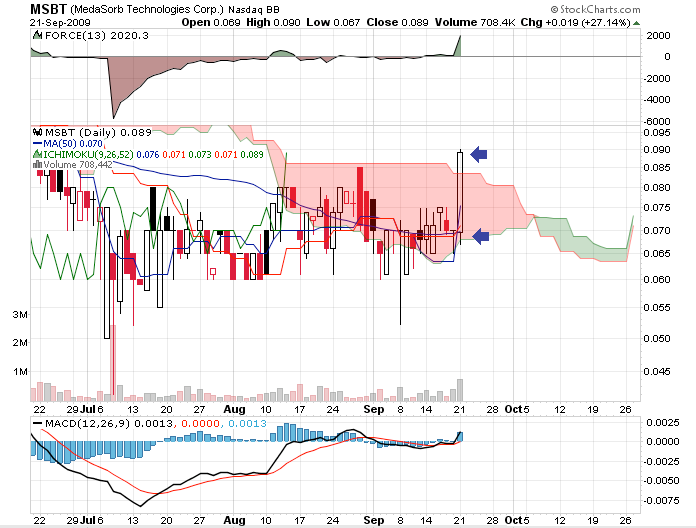
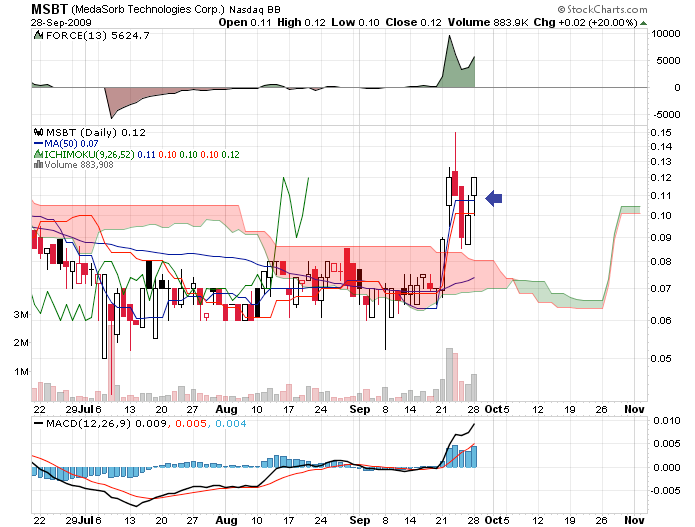
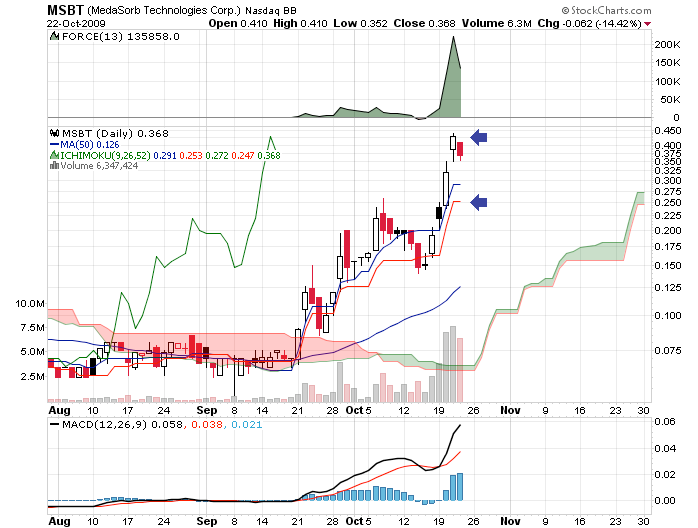
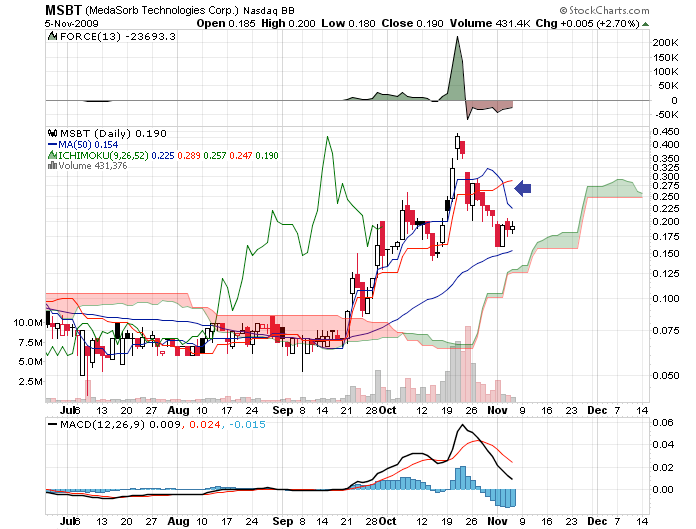
These are my sell signals when trading penny stocks. This is not for trend trading using the traditional ichimoku method. This is for short term holds.
Above the Kumo Sell Signals
1 - Sell after a Pop - Whenever price starts to get too far ahead of KS you will usually see a correction in price action. Depending on other indicators (ADX and ATR), you would exit when there is a large gap between KS and price action. This can be seen on the previous chart I posted. This doesn’t necessarily mean you would sell all your positions. You may only want to sell some and secure profits and let the rest ride until your second option exit strategy comes into play.
2 - Strong Sell - Your second option is to sell whenever price falls below KS. KS acts as major support for price action and whenever price falls below we can expect the downtrend to continue. This locks in your profits before waiting for the final exit strategy and the one that is also most commonly used in trend trading the forex market.
3 - Confirmed Sell - Your third option is to sell whenever TS crosses back below KS.
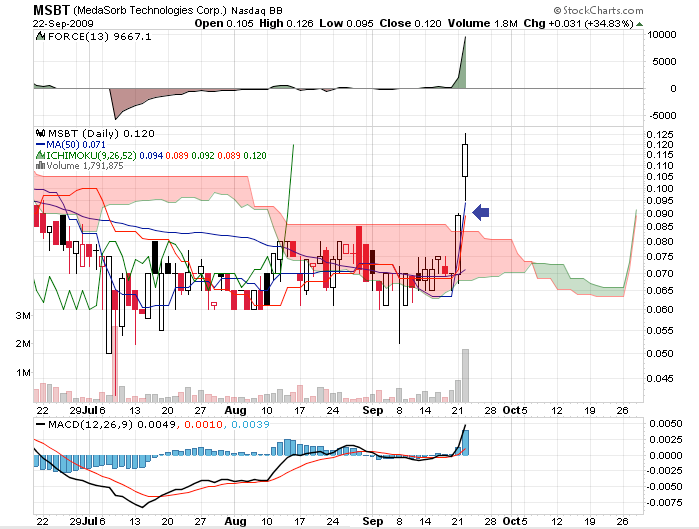
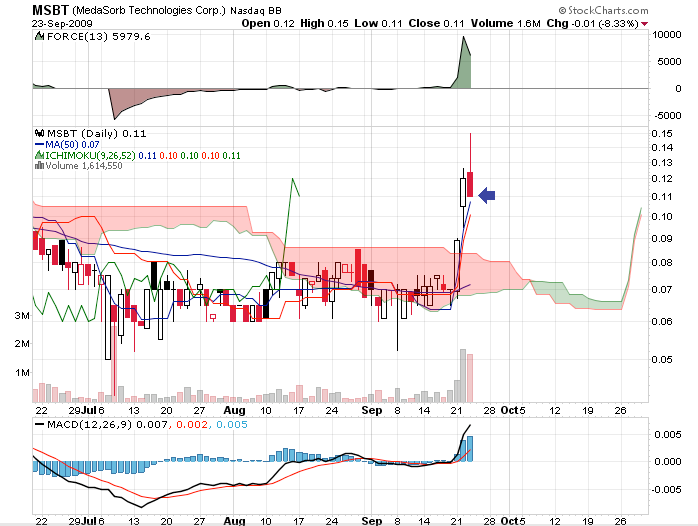
Below the Kumo (will add on later)
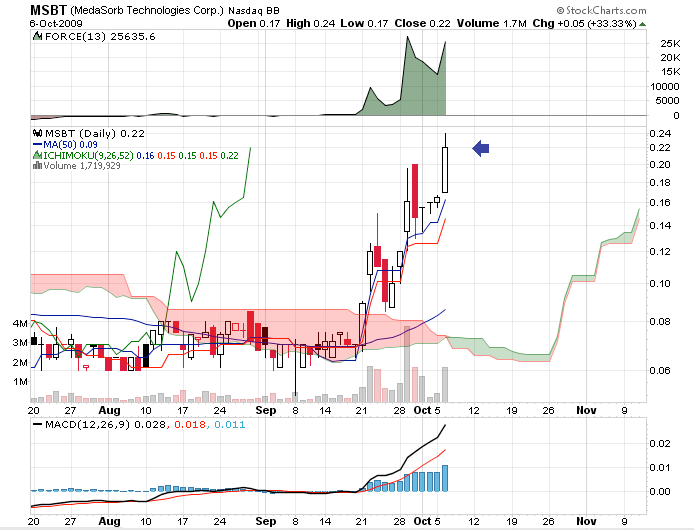
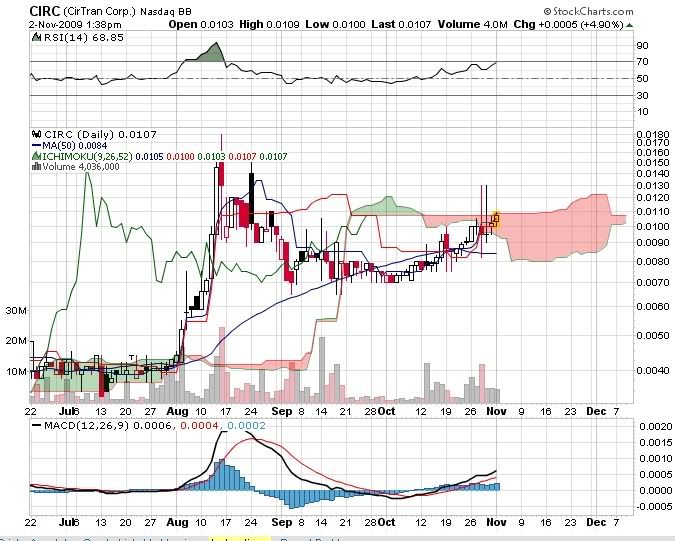
If you enter a long position below the cloud (like CIRC) and price moves into the cloud, but fails to break the cloud you may consider selling some or all of your shares then. The cloud is acting as strong resistance at that moment and the stock may take several days up to several weeks to consolidate at that level. If anything, price could drop and that’s why you would want to exit and secure profits.
I sold all of my shares in circ at .011 for a small profit as it was having trouble getting through the cloud. All other indicators still look good. When it breaks the cloud and holds I will reenter my long position.
What trading platform do you all use?
I use NinjaTrader with MedianRenko bars set @ 4 ticks.
Only trade on the cross of the Chikou-Span lagging 27 bars, and the price itself.
Gilbert.
I have posted this on the Kumotrade forum, but since that forum is very inactive I am posting this question here as well. I have also posted in in the newbie forum but I am desperate for answers and this seems to be the place with the most ichimoku experts, so here goes.
Could someone please explain to me how exactly one uses the Chikou Span to confirm Tenkan-sen or Kijin-sen crosses or Kumo breakouts?
It seems that everywhere I read it says the same thing: If the Chikous Span is above or below the price curve this can be used to confirm a cross or breakout.
But when trading live the Chikou Span is 26 days behind us! So we don’t have access to it. And just putting a trend line at the current level of price to compare to the Chikou Span is useless too since the Chikou is always at the current price level, (its the current close displaced 26 days back).
So if the Chikou Span is the close of the most recent price, set 26 days back, what does “chikou span is higher or lower than the price curve” mean? Isn’t the Chikou Span always AT the current price curve? Am I missunderstanding the term “Price curve”? Dosn’t it mean the candles representing the current time period?
I have scoured the web looking for answers but the best explanation I can think of is this:
“If the Chikou Span is higher or lower than the price curve” means if the current price is higher than the candles 26 days ago, that can be viewed as a bullish confirmation of any Tenkan-sen/Kijin-sen, Kijin-Sen crosses or Kumo breakouts and if the current price is lower than the candles 26 days ago, its a bearish confirmation.
So as an example, looking at the EUR/USD graph, for Dec 7 we see the candle breaking down into the Kumo, indicating that in the next day or so we may get a fresh down trend, (price may close beneath Kumo). We also see the Tenkan-sen is converging with Kijin-sen and will probably cross under in the next day, (with the next candle) indicating a downtrend as well.
To confirm with the Chikou span we look back to the corresponding part of the Chikou Span, which occurs on Nov 10, on the graph. We see that the Chikou Span is 200 pips or so beneath the candle, so this is taken as a confirmation of a bearish signal and gives credence to the idea that a fresh, long term downtrend may be in store for the EUR/USD. For those who only trade if kumo break out, Tenkan-sen/Kijin-sen cross AND Chikou Span all confirm the same thing, a shorting of the EUR/USD would be valid, (assuming that the price closes beneath the Kumo and Tenkan-sen/Kijin-sen cross occurs).
Is that correct or am I completely wrong?
I have tried back testing without the Chikou, and my performance has suffered immensly (with back testing) as I often get faked out by false break outs. I know that if I could just learn what people mean by use the Chikou Span to confirm, I could really improve my trading performance.
And if anyone knows of any visual examples such as a graph or videa that clearly shows how one uses the Chikou Span that is 26 days back to trade in real time, (where there is no Chikou Span) I would greatly appreciate it.
ANy thoughts on USDJPY?
Looks like a nice bounce off the kumo. Need the chikou span to come down below the price though…
[QUOTE=SanMiguel;155612]ANy thoughts on USDJPY?
Looks like a nice bounce off the kumo.[B] Need the chikou span to come down below the price though…[/[/B]QUOTE]
SanMiguel do you mean that the Chikou Span is currently slightly higher than the candles of Nov 7-9 on the daily USD/JPY chart?
If so, (which indicates that I correctly understand the concept of confirming T/K crosses and Kumo breakouts with Chikou Span) then yes, it looks like another long term shorting oppertunity of the USD/JPY may be upon us.
Of course Tenkan-sen would need to drop beneath Kijin-sen but if we get another solid negative candle this should occur and Chikou would then be beneath the price curve of Nov 11. So if this happens, it should happen within a day or two.
In that case I will be waiting to add to my newly minted meetpips account.
By the way, if you’re interested in shorting the Yen, all Yen based pairs are prepping for a down trend, AUD/JPY, CAD/JPY, EUR/JPY and GBP/JPY are entering Kumo and EUR/JPY is actually breaking Kumo now.
We just need TS to Break Ks downward and we’re good to go, since Chikou Span is bearish on all, or soon will be, (assuming of course that I am correct in my understanding of what Chikou Span confirmation means, if someone could please confirm this, I would be most appreciative).
Kumo is the heart, but for the strongest signal everything has to line up. On my daily charts the TK’s are actually about to cross upwards. Could just be a retrace to more downward movement, but don’t jump the gun either way.
EJ w1 is still in the kumo, and if you look at the w1 it’s in a range, where it’s aroundthe bottom of that range. AJ broke above the Kumo on D1 and is above the kumo on W1.
ArmyDoc,
The Chikou Span is nothing more than a line of all current closing prices shifted backwards 26 periods. How does this help us confirm anything now? I wondered that myself, at first. Here’s how Chikou Span confirmation works:
If I am looking to go long, and the line of current closes (Chikou Span) is below the price curve of 26 periods ago, then that’s not encouraging. That means that, whatever level price was at 26 periods ago is still higher than it is now. If, however, I am looking to go long and the line of current closing prices (Chikou Span) is [B][U]above[/U][/B] the price curve 26 periods ago, that means price is higher now than it was then. That’s encouraging.
The same holds for going short. If I want to go short, but the line of current closing prices (Chikou span) is still above where price action was 26 periods ago, that doesn’t look good for going short. If, however, the line of current closing prices is actually below where price action was 26 periods ago, then that would confirm any other sell signals.
I’m sorry I’m at work…I don’t have any charts to show as examples.
I hope this helps clear up the confusion.
If y’all want to see alot of great examples of ichimoku trading successes, you should check out Ichimoku forever @ Forex Factory" I know it is on another forum, but they have a very, very active ichimoku thread with over 6,800 posts.
Today 3 new trading oppertunities:
EUR/USD: short, stop @ 1.48921
GBP/USD: short, stop @ 1.65804
USD/CHF: long, stop @ 1.01448
Nearest upcoming possible trade: AUD/CAD, short, if it closes down in the next day.
This is the first daily log of my trading the Ichimoku Kinko Hyo system described in the first post. There are just one difference between the OPs system and what I am using.
I don’t use trailing stops or take profit points, rather exits are based on the following:
Stop loss, (based on Chikou Span supports or resistance) OR
T/K cross against the trade
UNLESS Chikou Span indicates trend will continue
From yesterday, (day 1 of live demo trading for me) 5 initial trades, (based on trends already in progress).
AUD/NZD Long
EUR/NZD Long
NZD/CAD Short
NZD/USD Short
NZD/JPY Short
3 trades today:
USD/CHF Long
EUR/USD Short
GBP/USD Short
I am risking 1% of capital/trade
Total System Performance so far:
Outstanding Trades: 8
Outstanding Performance so far: 3 winners, 5 losers
Total Pip profit: +8
Biggest gainer: Short NZD/JPY +150 pips
Biggest loser: Short NZD/CAD -43
Due to leverage ratios of between .29 and 1.46 per currency trade the system is down slightly, as can be seen in the screen shot of the account performance thus far.
Attached are graphs of the 3 trades made today and the account summary.
For future reference: On the graphs
Tenkan-sen= white
Kijun-sen= red
Chikou Span=purple
Note: future graphs will have Kijun-sen as yellow, since that is easier to see.
Seems to be a lot of confusion over the “Chikou Span”—let me give explanation a shot.
Don’t even think of it as a line—the line is just to make it easy to see. All Chikou Span is trying to tell us is this:
Is the price right now above, below, or the same as the price was 26 periods ago. That is it!!!!!! Nothing more to it then that!! Obviously if the price right now is below where the price was 26 periods ago the price must have trended down from then to now. Vice versa if the price now is above where the price was 26 periods ago. You can do the same thing without the Chikou span---just count back 26 candles and see what the price was back then, and compare that to the price now.
As far as using Chikou for S/R, that is an entirely different subject. That is beyond the very simple basic meaning of Chikou Span.
Hopefully I am not full of Banouchi.
Potaire
First let me thank Potaire for the most concise and understandable explanation of using the Chikou Span I have come across. Hopefully future readers will gain from your wisdom.
Now to today’s log entry.
First I would like to announce that I will be tracking 3 Ichimoku systems, all basically the same but with a few important differences.
Ichimoku 1 is the system I described yesterday.
Use daily chart only: Enter when T/K signals bull or bear trend, candle closes above or beneath Kumo and Chikou Span confirms by being beneath or above price curve.
Exit when T/K crosses against the trade unless Chikou Span signals that trend is still strong, (if it’s neutral exit the trade).
Money management: 1% capital risk/trade stops set at nearest Chikou Span support or resistance.
Ichimoku 2 is the same as 1, BUT 3% capital risk/trade and the stops are placed 20 pips above or below the Kumo cloud, (the capital risk is higher since the avg stop is 150 pips for Ichimoku 1 but 335 for Ichimoku 2)
Ichimoku 3 has the same rules for entering and exiting a trade as 1, (place stops using Chikous Span resistance or support) but has 3% capital risk and uses daily charts to time a trade but is trading using weekly charts to verify the daily trend and the stops are placed using weekly charts, (so far average stop is 453, thus the 3% capital risk)
In essence system 3, you check daily charts to see if there is a new trend, then verify that the weekly trend is in the same direction.
Now on to today’s trades:
[B]Ichimoku 1[/B]: Shorted EUR/CAD as soon as candle closed beneath Kumo. (see attached graph)
Stopped out on AUD/NZD Long, EUR/NZD long and NZD/CAD short.
Happened because of the news today, although I don’t know why AUD/NZD long didn’t go up instead of Down, since the great news today was Australian unemployment going down.
Total realized losses: -3.3%, ( that extra .3% came from EUR/NZD slippage, the spread exploded to 45 pips as my SL triggered).
Ichimuko 1 Trading stats:
Account Balance: -3.3%
Unrealized profits: -.4%
Closed trades: 0-3
Best gain: NZD/CAD short, -61 pips
Worst loss: EUR/NZD long, -205 pips
Active trades: 4-2
Best trade: NZD/JPY short, +35 pips
Worst trade: NZD/USD Short, -75 pips
[B]Ichimoku 2[/B]
Shorted EUR/CAD same as Ichimuko 1, but due to much larger stops no closed trades today, though if the NZD dosn’t drop tomorrow I will most likely be forced to exit EUR/NZD long due to T/K crossing downwards, (Chikou Span is already neutral) or I may be stopped out.
Ichimoku 2 Trading stats:
Unrealized proft: -6%
Active trades: 4-5
Best trade: USD/CHF long, +20 pips
Worst trade: EUR/NZD long, -470 pips
[B]Ichimoku 3[/B]
Only 2 pairs offered valid trades, USD/JPY short and GBP/CAD short, (see attached graphs) as always Tenkan-sen is white, Kijun-sen is yellow and Chikou Span is blue or purple.
Ichimoku 3 Trading stats:
unrealized proft: +.05%
Active trades: 2-0
Best trade: USD/JPY short, +4 pips
Worst trade: GBP/CAD short, +2 pips
Possible upcoming trades: AUD/CAD short, stubborn pair has toyed with me for 3 days! T/K and Chikou Span are ready for shorting, but it won’t close under Kumo, maybe tomorrow.
All other X/CAD pairs other than USD/CAD for shorting as well, (US/CAD has Chikou Span neutral and would take a few days of drops to confirm a downtrend).
X/JPY pairs, all are strongly negative on Chikou Span and under Kumo but for some reason Tenkan-sen is above Kijun-sen and in some cases is actually going up! If Yen continues its rally then there will be 7 trading oppertunities in the next couple of days.
So today I was hit by the realization that when live demo trading long term trend trading systems such as the Ichimoku, you have to pick one system and stick with it, you can’t have many running simultaneously. This is because it would take many months to verify if you can make money with that particular system. With limited time constraints I can’t track 3 different systems so I must choose one.
So I asked myself which Ichimoku system embodies the essence of position trading? Well its a largely set and forget system that has fewer trades that can last several months.
For something like this we need large stops and entry and exit points that minimize fake outs.
So I am abandoning the tracking of Ichimoku 1 and 3 and focusing only on Ichimoku 2.
As a reminder, here are the rules:
Enter:
Money mangment: 3% capital risk, Stops set at 20 pips above or below Kumo.
Exit: When all 3 signals point in other direction.
Now, for updates regarding this system.
12/09/09 saw our first stop out: EUR/NZD long for loss of 605.2 pips, (this was an older bullish trend I was hoping would continue, thus the Kumo was far below the price and the stop was big). The % loss was only 3.1% of capital.
12/09/09 Also saw 2 new trades, AUD/CAD and EUR/CAD short, because these were brand new trends, the stops were much smaller, 180 and 322 pips respectivly.
So far the system is down 3.1% realized loss and down 3.3% unrealized losses.
Personally, I think those SL sizes are too large - do you have some charts of the entries?
Have you tried the strategy tester?
It allows you to go back through trades in a visual format testing separate parts of a system. You can speed the chart up and pause it when you need to.
trade Simulator.zip (488 KB)