@tommor I agree 100% - Technical analysis is overrated. I know you are a ‘trend trader’ as I am, its all very simple - the market goes up - down or sideways and tends to do what it is doing for a period. Now, you work high timeframes while I work 5mins/1min timeframes but this is just relative, a personal preference, take away the price axis and time axis and you wouldn’t know the difference. Moving Averages are the only indicators you need (some guys don’t even bother with them). It’s like watching a river flow, you like big slow rivers I like fast moving streams.
Tom Hougaard in his very good book ‘Best Loser Wins’ sets out how different traders will draw different trend lines - how Fibs work ‘sometimes’ and candlestick patterns have been thoroughly debunked in extensive tests in a research article ‘A Statistical Analysis of the Predictive Power of Japanese Candlesticks’-Jamaloodeen, Heinz and Pollacia.
Love that Bob Dylan song -‘Watching the River Flow’
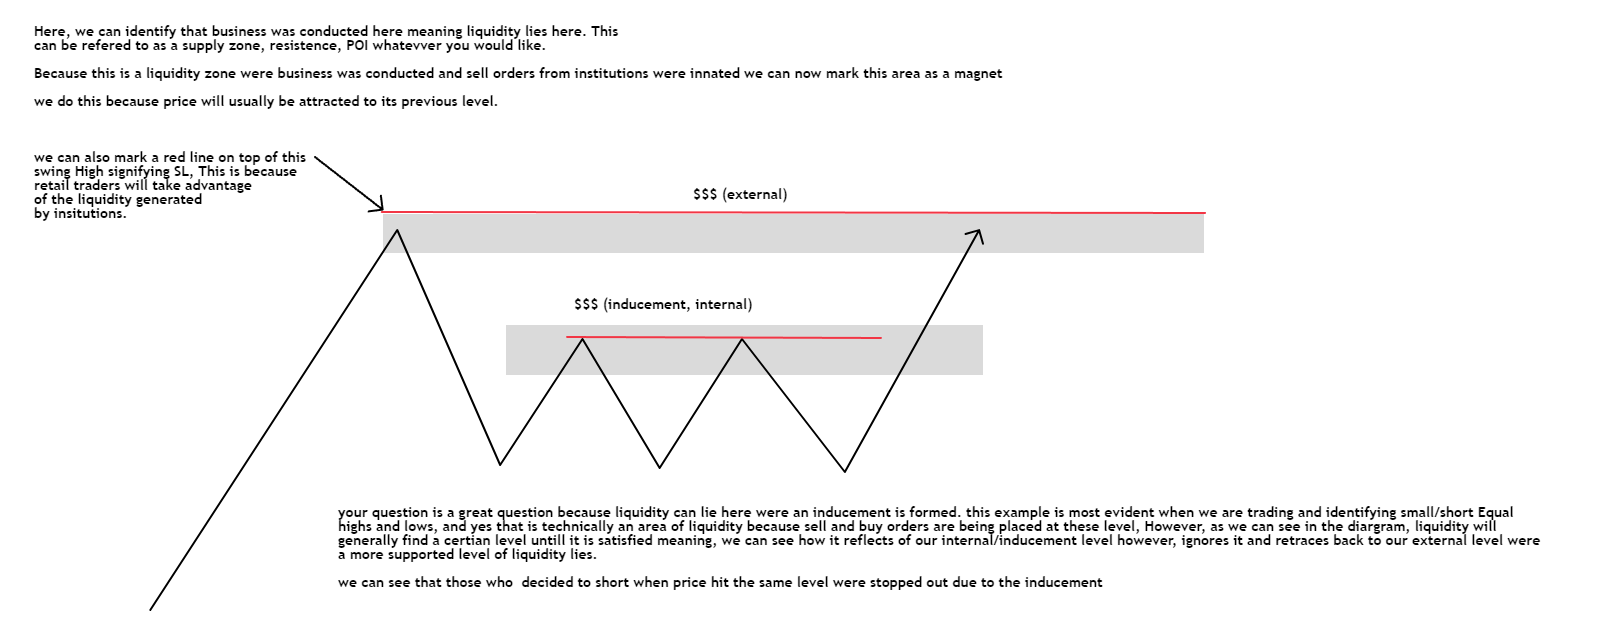
hi @tommor, IMO liquidity is an area of where business was conducted earlier through which retail traders take advantage of the given opportunity. heres a visual…
where the green area is support/supply which liquidity lies underneath and at the next swing low were majority of SL are placed.
Now to answer your question about how/why some areas are classified as a liquidity area and why some aren’t, this really depends on market structure first.
i hope this makes sense i struggle abit articulating my thoughts and feelings sometimes because i have alot of thoughts racing in my head, so when i try to project the idea onto paper, it looks stupid
there is so many different things about liquidity to also study which i need alot more, such as FTC, FTB.
liquidity technically does lay everywhere because past business has been conducted however, IMO its marking out significant swing highs and lows,trendlines and certian POI’s to help me identfy the stronger areas. this is just my opinion
At every price level that I see on the DOM with Level 2 data, there are always pending orders (liquidity). Some of these levels correspond with swing points, some with FVGs, some with supply & demand zones, some with nothing at all, but there seems to be some liquidity at every price.
So I’m asking, does it really matter?
Long before SMC and liquidity concepts became the fad, traders were able to make profits and the charts were still the charts which are a visual representation of fear and greed in the market.
With iceberg orders and dark pools, how can anyone truly know where the liquidity honey pot really sits? Even reading the DOM and seeing pending orders, I have no way to distinguish between a buy limit order that is an entry vs a buy limit that is a take profit. That’s in the futures market.
In Forex especially CFD forex, most of us aren’t liquidity for anyone except the broker.
hi @MartialChartsFX, yes i agree i just like to use the concepts that work for me i need more practice of course.
“In Forex especially CFD forex, most of us aren’t liquidity for anyone except the broker.” no retail trader can contribute to the market majority of course moved by institutions that’s why i mark out MY liquidity levels and use the liquidity to my advantage.
before taking a trade off liquidity i like to ask myself where are the current SL? maybe they are above/below the swing high/low ususally understanding this and the current level and overall market structure helps me with this concept.
i dont know i think everyone should just do what makes sense to them, i find that this makes clear sense to me if FVG, SNR, supply and demand work for you stick to that.
I’m just asking in general if it matters. Like did Richard Wyckoff concern himself with liquidity over 100 years ago or was it baked into his theory? I don’t use Wyckoff theory, so I don’t know the answer to this.
I question the usefulness of liquidity when it appears to be everywhere and the liquidity that is swept tends to be arbitrary. How can we know when the banks liquidity needs are met until after the fact?
it states in the phases if you scroll down that he uses liquidity, he talks about the role of liquidity is the financial markets and, in some of the phases taps in liquidity are mentioned.
this is a great question. Like i made mention before to trading xau/usd ill show the set up down below. Your right in how it appears everywhere, however, depending on market structure in this case i used swing highs to mark out the existing levels of liquidity.
This is one of those things I wonder about because buyers are liquidity for sellers and sellers are liquidity for buyers. Are the banks actively moving price to where liquidity rests or is liquidity resting where it expects for the banks to move price to? Kind of like which came first, the chicken or the egg.
Every trade has to meet somewhere, so I try to consider the intent of the party that takes the aggressive role in getting to that meeting spot and how it benefits that party.
This is an example of Gold with an AMD after the fact:
But in real time when the breakout occurs it’s not apparent or rather confirmed that this is a run on liquidity. It could have been a legitimate breakout.
I guess the ‘correct’ area of liquidity is the level that satisfies the banks. Without knowing when the banks are satisfied except until after the fact, it makes it difficult to know a correct area in real time. The best we have are probabilities and risk management for when those probabilities prove to be improbable.
This is a fascinating topic. Thanks for posting it and for the discussion.
hi @MartialChartsFX, i like how you make mention in charts of real time and the confirmation required to know if liquidity will run under certian highs/lows.
this is exactly true with the chicken and the egg metaphor. I try to believe that banks are pushing to a certain price until they are satisfied just as you remark, I believe they do this to purchase at a certain level/sell at a certain level to provide benefit/gain for themselves obviously, we just have to be smart as retail traders to take advantage of these movements.
couldn’t say it any better this is true. I like to mark my areas out and try to use other TA and my own thoughts to find the “correct area”, however, it can only be found out through real time, RM and MM.
Liquidity on price charts highlights areas where price spent the most time, indicating strong market interest. The Volume Profile indicator visualizes this, helping traders identify key levels for execution without significantly impacting price. It’s essential for precision.
Good points on liquidity zones. I’ve had the same issues targeting the right areas. I usually look at key price levels with lots of movement since institutions often come back there. Using liquidity zones for take profits makes sense. Anyone else have different methods?
i agree, it would be interesting to take a different approach. @EmeraldEyes and @brainchild2, make refence to the volume profile indicator, which is used for identifying precise levels of liquidity, that could be a different approach
Same here. I also focus on key levels with significant price action but I combine those with volume spikes to confirm the activity. Do you think certain timeframes work better in finding the liquidity areas?
when using the volume indicator on a htf, it will display stronger liquidity zones or Order blocks (OB) which will be respected more.
im abit confused with this indicator so do these volume histograms represent OB which then will drive towards a liquidity level like how does it work in terms with liuquidty like what is the relationship?
The market is dynamic. Because of that, liquidity areas are perceived differently. The underlying purpose of this thread is Draw on Liquidity (ICT’s concepts) which answers the question: where is price likely headed?
I am not a student of ICT but like someone said, you have to determine the External Range Liquidity (ERL) made up of old highs/lows and the Internal Range Liquidity (IRL) made up of your order blocks, fair value gaps. Since price will only seek liquidity you have to always determine these as targets for your trades. Of couse, all this makes sense if one is student of ICT. Supply and demand traders, momentum traders, currency strength and weakness traders, etc, have different views of what constitutes liquidity.
Run with whatever you have. As long as your perception of what makes up liquidity works for you it is all good.