I know that if price action is flat and the idicator’s line is ascending/descending we can talk about a divergence, but is the opposite correct ?
I’ll put an example below
I know that if price action is flat and the idicator’s line is ascending/descending we can talk about a divergence, but is the opposite correct ?
I’ll put an example below
Yes, if price is saying one thing and the indicator another, that is divergence.
However, the way you have added lines to your price and indicator charts might not be the most helpful approach. Price trendlines are usually drawn through the lows for an uptrend and through the highs for a downtrend. But when comparing price action with indicator action, its perhaps more useful to compare the new high in an uptrend with the indicator’s newest score. So, if the new price high is higher than the previous price high but the new indicator score is actually lower than on the date of the previous price high, that’s a clear divergence. Using trendlines on an indicator chart is potentially an issue as they are typically limited to a range between 0 and 100, whereas price can go to almost zero or infinity.
Thank you for your answer.
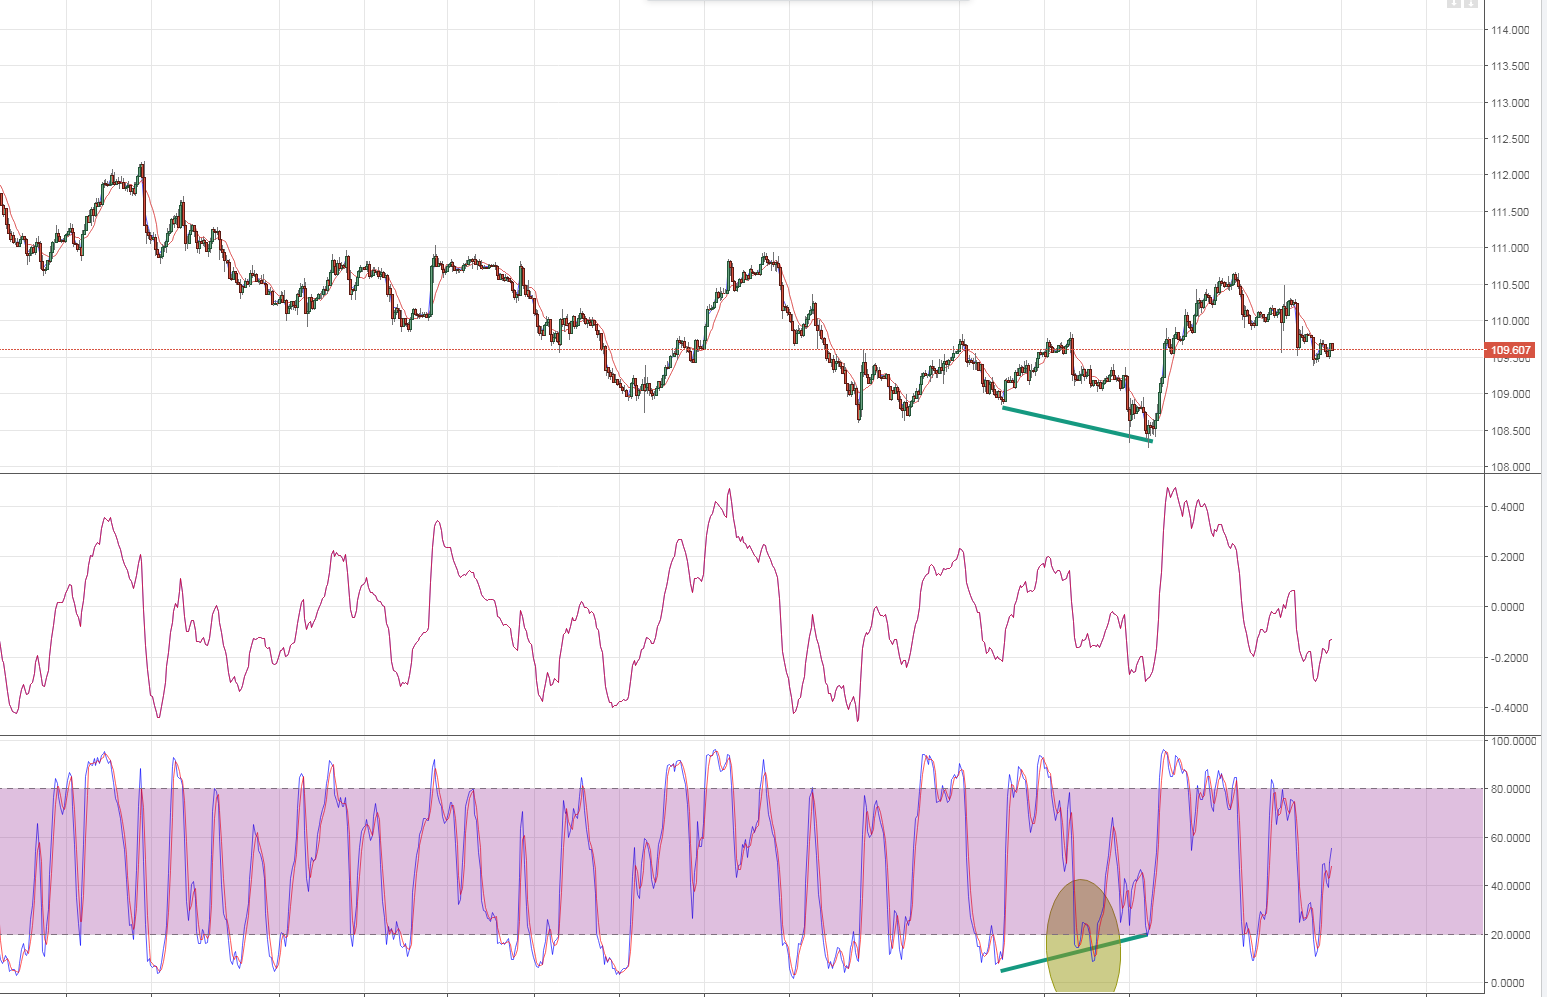
I know that simply comparing 2 and only 2 consecutive lows/highs it’s a more solid way to spot divergences but I’m tesing at the same time divergences which may occur during an extended period, like the one in the picture.
So these are all valid combinations:
flat price / ascending indicator
flat price / descending indicator
ascending price / descending indicator
descending price / ascending indicator
ascending price / flat indicator
descending price/ flat indicator
Yes - any time the indicator does not confirm what price is saying, you should treat it as a divergence and get suspicious.
Of course, price can do the unexpected whatever any indicator says.
One last question: if the line I draw on the indicator is cutting through peaks/bottoms like in the picture below, is it a valid divergence ?https://i.gyazo.com/2f826a0a952a3b262e9fcd182af3be02.png
You can’t draw a precise line like that on the indicator chart that ignores some of the data and cuts through some parts and respects others. You can’t ignore some information just because it doesn’t fit with your theory.
I think maybe is more difficult to recognize divergence on the stochastic oscillator instead of the Relative Strength index. The latter indicator can create a rising or falling tendency also.
