Introducing the Black Swan trading system

Hy guys,

New to the forum, decided to share the system I have been testing along the past 2 weeks, which I developed based on two different systems was using before. I thought it would be good if we could share more experiences

I named it the Black Swan as it is based on smooth soft curves and serves primarily longer time frames. I have tried it with several pairs and so far found it works best on pairs with JPY, NZD and AUD. My favourite are AUDUSD AUDJPY NZDUSD NZDJPY EURJPY. I got 66% success rate in the first two weeks. But tests are really recent so…

Time-frame: 4H
Indicators
HMA 64
Bollinger Bands 16
MACD 10,20,10
ATR 10

Signal Long: when first candle closes bullish and completely (inc wicks) on the other side of the HMA 64 (coming from below before) AND MACD is bullish.

Short: enter short when candle closes bearish and completely (incl wicks) on the otherside of the HMA 64 (coming from above) AND MACD is bearish.

To fine tune entry point go to the 15mn chart and entry when price is close to moving average and BB mouth is widening. Also as a matter of fine tuning as this system is about identifying trend shifts, I also use RSI 7 to identify possible divergence on 4H. Nevertheless, it is not mandatory.

TP x3 ATR
SL x1,5 ATR

Would be cool if anyone is willing to give it a go with me and let me know how it went.
Thanks!

2 Likes

Hello! Can you post some trades you took with this system?

1 Like

Date Pair Buy/Sell Open SL TP Justification Close Value Close Manual / SL Notes on Closing
1 02/04/2018 AUD/JPY Buy 81,72 81,38 84,89 BUY signal - two red candles closed completely after HMA 64 and bullish flag pattern on 1D + Sto and MACD aligned up; touching above HMA 64 on 4H; indicating retracement by touching lower BB on 1W. 81,38 SL Adjusted to tighter SL 81,38 just below lower BB level, as JPY valorisation was too strong in several currencies and opened a SELL position to hedge the loss
2 02/04/2018 USD/JPY Sell 106,24 106,56 105,36 SELL signal with both candle closing below HMA 64 and MACD bearish, bearish pennant, HOWEVER WAIT to check confirmation of trend on next 4H candle 105,86 Manual Price action started looking bullish and external prediction from DailyFX indicates possible bullish rally

03/04/2018 USD/CAD Sell 1,2887 Bearish rectangle under HMA64 1,2628 Manual Profit lock in
03/04/2018 USD/CAD Sell 1,2874 Bearish rectangle under HMA64 1,2628 Manual Profit lock in

03/04/2018 AUD/USD Buy 0,7689 0,759 0,7762 2 candles closed above HMA64 and hit lower lows of the year 0,7714 Manual Price action forming bearish pattern

05/04/2018 USD/CAD Sell 1,2771 1,2929 1,2681 Signal set of candles below HMA64, following trend 1,2763 Manual Major news tomorrow, pair will most likely negotiate sideways, opening value is not hig enough to protect from eventual counter trend movement due to news
05/04/2018 AUD/USD Buy 0,7695 0,763 0,8099 Still negotiating above HMA64, nevertheless, a lot of pressure and fearing major news tomorrow, if it breaks 0,7636, it will most likely go to lower lows of the year, if position survives tomorrow, it will most likely rise but will be an over weekend open Position already tested twice the 0,7670 level, but rose rapidly from there, it seems to be forming a bullish wedge on 4H and it the low is still higher than the previous two 0,7648 and 0,7636

An unfortunate choice of name

1 Like

Hello @eddieb, why is that? I am not fussed about the name though… any suggestions?

From Financial Times/Lexicon

“Definition of black swan
An event or occurrence that deviates beyond what is normally expected of a situation and that would be extremely difficult to predict. This term was popularized by Nassim Nicholas Taleb’s book “The Black Swan: The Impact of the Highly Improbable.” Mr Taleb is a finance professor and former Wall Street trader.
He took his title from the shock that Europeans experienced when they discovered black swans in Australia. Until then, their data told them that all swans were white, so the discovery was unexpected.
A black swan in markets is an event that has not occurred in the past, thus rendering useless risk management models based on historic data. Such a risk model would assume that all swans were white.
Mr Taleb suggests his idea has been misunderstood. The problem, he told the CFA Institute in 2008, is not that black swans occur often. Rather, it is that they have truly catastrophic and unpredictable effects.”

The most recent true black swan event in the financial markets was the 2015 depegging of the Chf from the Euro which caused the Euro to plummet in minutes without warning. Many forex traders lost their entire accounts, even going into the red as stop losses were unable to trigger, and some brokers lost millions or went out of business altogether

Thanks for taking the time. My choice was grounded in the fact that I tried out this mainly with AUD and asian currencies and the black swan has a positive meaning that pre-exists the definition given in 2015:

“The black swan is the official state emblem of Western Australia and is depicted on the flag of Western Australia, as well as being depicted on the Western Australian coat-of-arms. The symbol is used in other emblems, coins, logos, mascots and in the naming of sports teams.”

Anyhow, as I said, it was purely circumstantial and the goal is to try out the system, not discuss its name.

1 Like

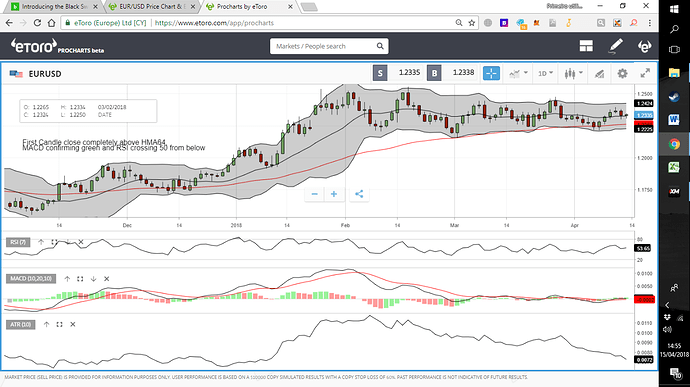
Hi, I posted some trades by copying some entries from my trading journal. Nevertheless, I see this might not be the best option. But I have been also doing some chart analysis on several pairs. I post below one example on the EUR/USD pair. If you opened on the 17/11/2017 (first candle completely closed above HMA64, with MACD and RSI confirming) you would actually have reached 2 ATR on the 27/11 high and 3 ATR on 29/12, but in any case the most important issue is that while price action does not cross the HMA64, it the trend is intact.