The second stimulus bill currently under negotiation may be the next catalyst for the decline in US Dollar. The negotiation between Democrat and Republican gained urgency last week as President Trump contracted the virus and required hospitalization. House Speaker Nancy Pelosi and Treasury Secretary Steven Mnuchin continues to negotiate a proposal to send second stimulus check and other aids to Americans. The Democrats offered a $2.2 trillion package whereas the White House administration offered $1.6 trillion. There is currently still a $600 billion gap between the two parties. However, both sides have come closer compared to weeks ago when negotiations broke down.
Pelosi outlined some key areas that need compromises such unemployment benefits and local funding. President Trump himself seems to be eager to strike a deal as he tweeted from Walter Reed Medical center. He pressed lawmakers and members of the administration to reach an agreement of a new coronavirus stimulus package as he receives treatment for COVID-19.
With the House scheduled to break following Friday’s session and Senate heading out next week, negotiation is running out of time before election day. But leaders of the Senate and House of Representative can extend the break schedule if there’s any agreement.
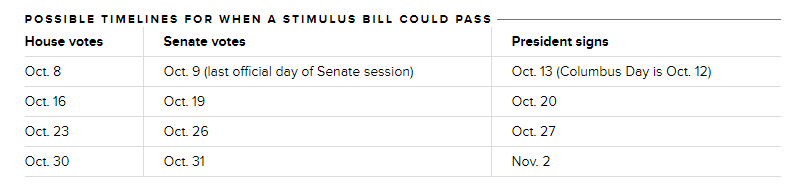
There’s also talk that an agreement on the outlines of a new stimulus package can arrive as soon as mid-week. If the stimulus bill can pass through, it may boost risk appetite and reduce demand for the safe haven currency such as Yen and US Dollar.
EURUSD Weekly Chart
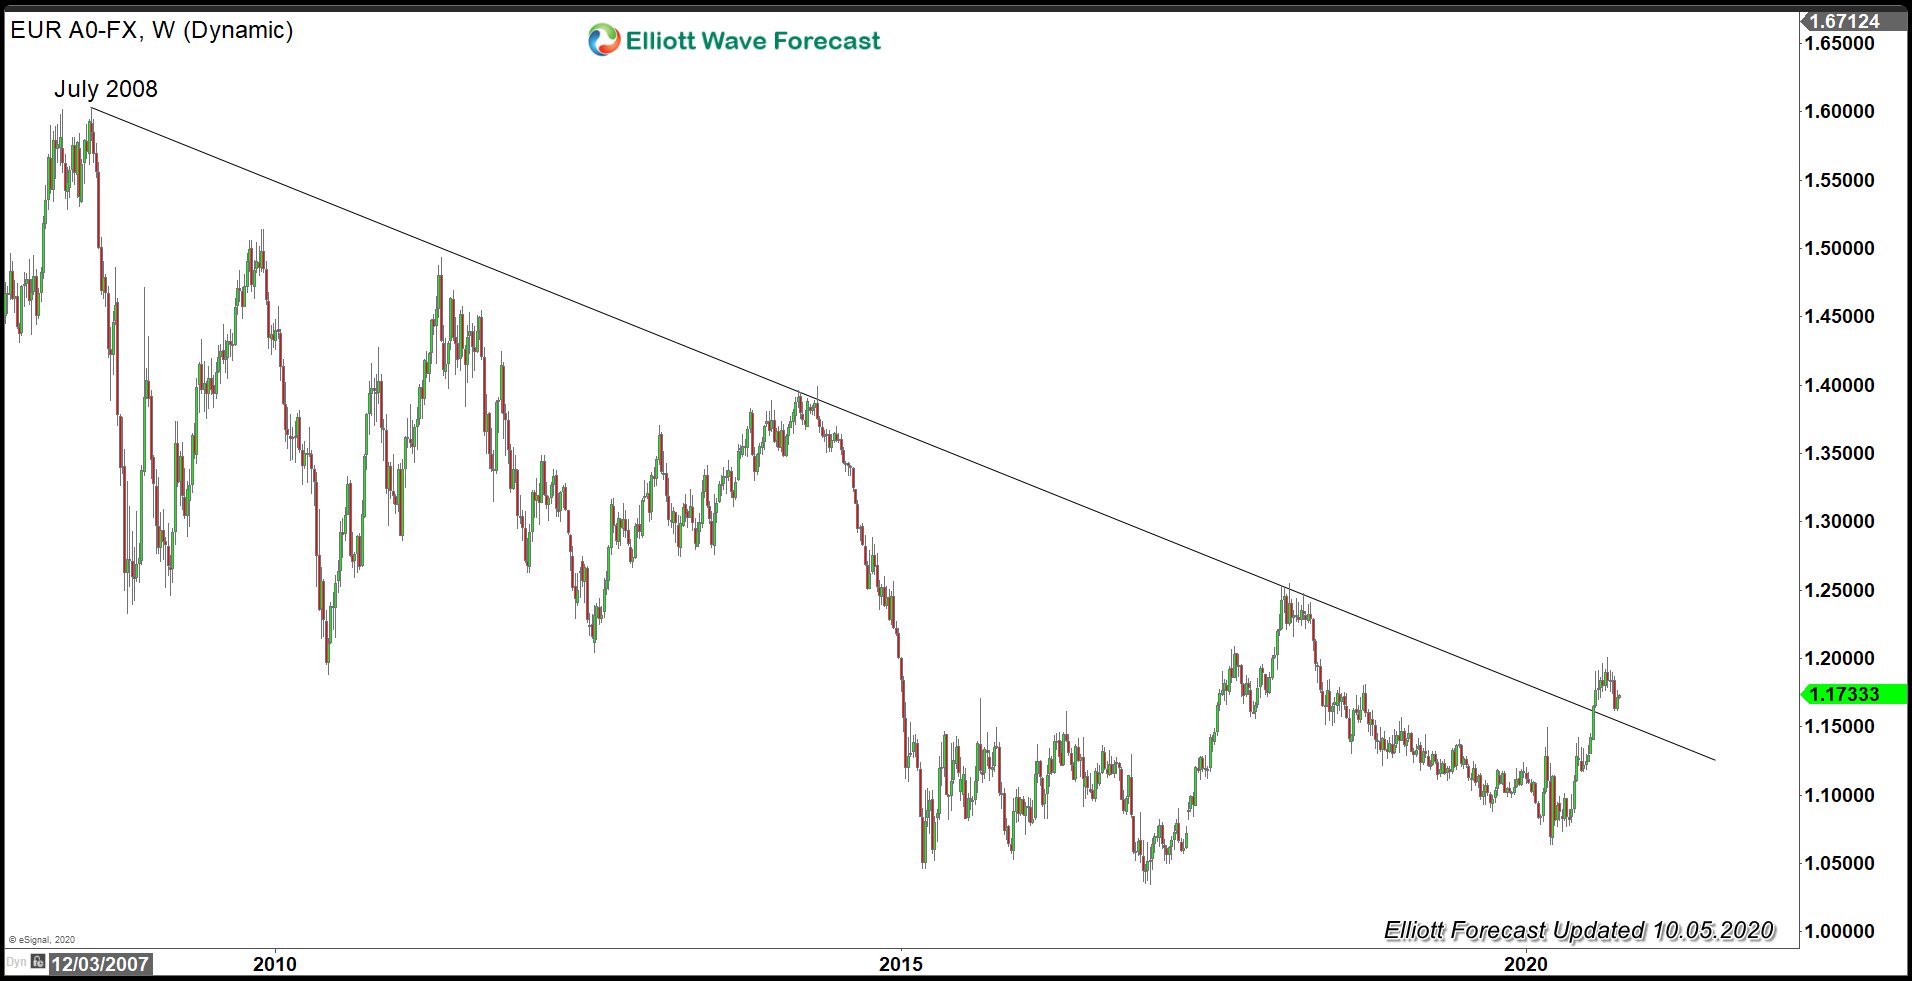
Weekly chart of EURUSD above shows pair breaking above July 2008 bearish trend line suggesting that the cycle is over. Pair may at minimum rally in larger 3 waves to correct the decline from July 2008 peak. Near term dips can see support in the sequence of 3 or 7 swing for further upside. The agreement on stimulus bill, if it happens, may be the catalyst for the next move higher.
EURUSD 4 Hour Elliott Wave Chart
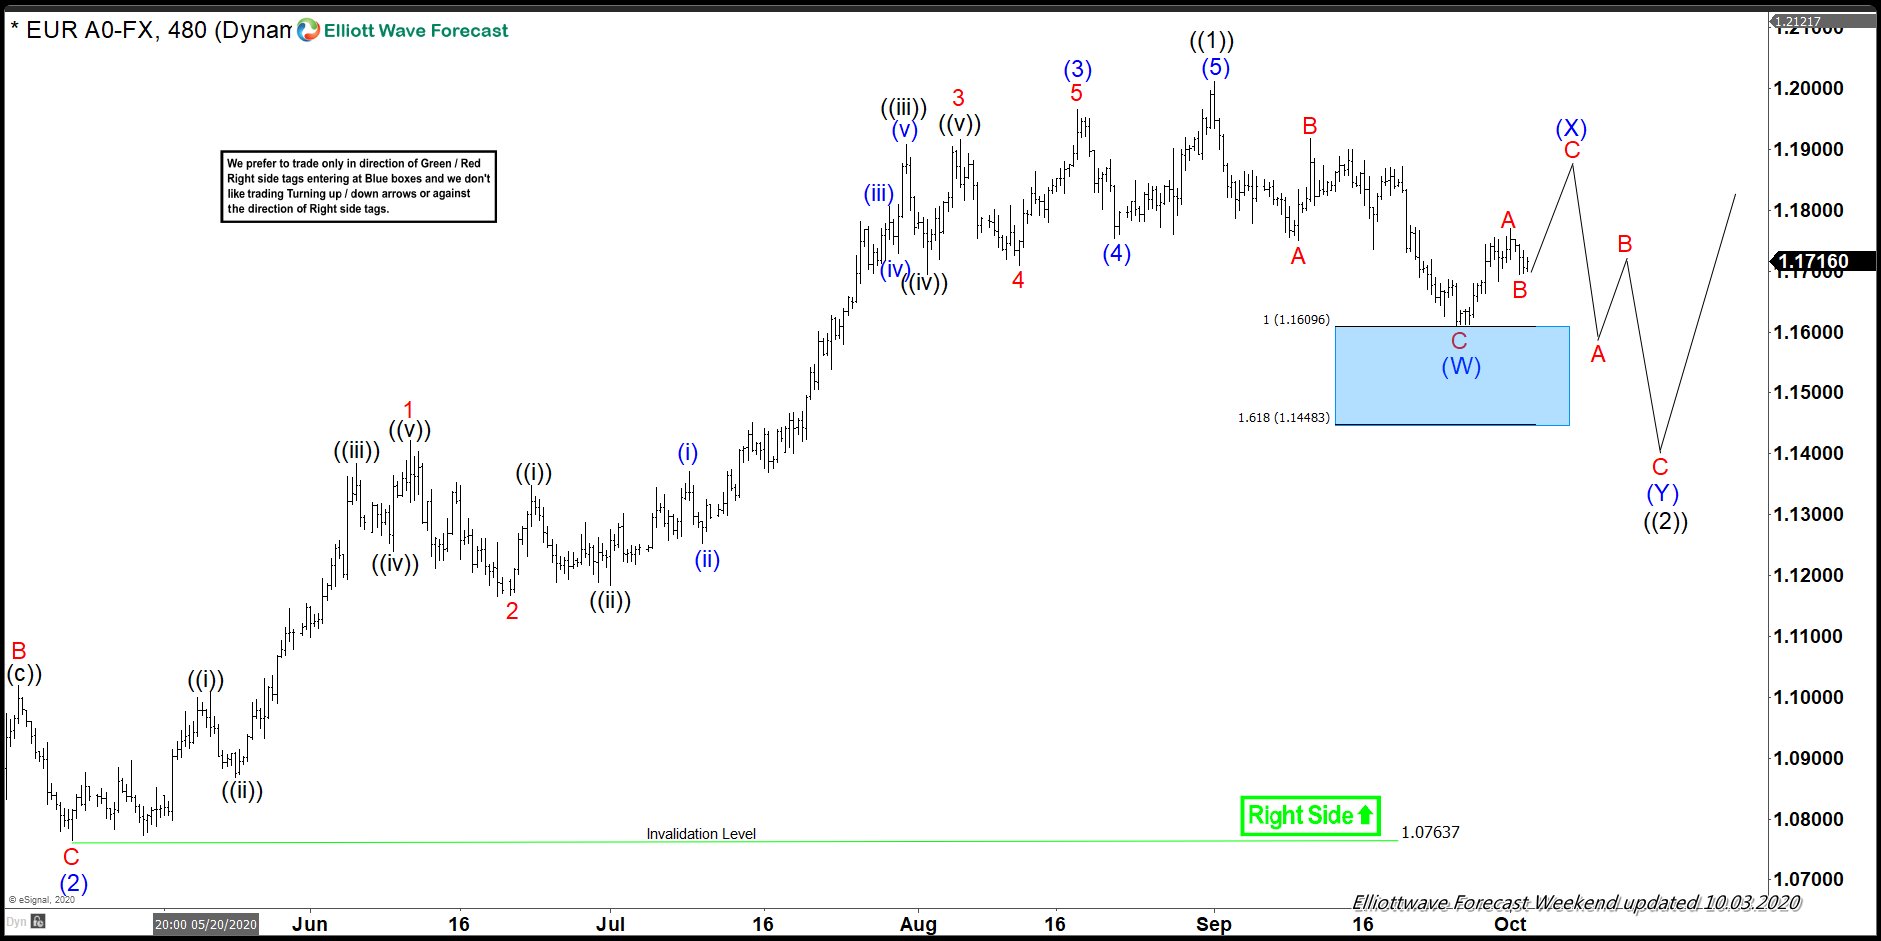
4 hour chart of EURUSD above suggests pair has ended a 3 swing pullback at a blue box and turns higher. It still has scope to do a 7 swing double zigzag to correct rally from March 20 low. However, as the first weekly chart suggests, pair has broken above 2008 bearish trend line and most likely should see more upside eventually. Thus, although a 7 swing pullback in wave ((2)) pullback still can happen, it’s not a must